CVS 2010 Annual Report Download - page 75
Download and view the complete annual report
Please find page 75 of the 2010 CVS annual report below. You can navigate through the pages in the report by either clicking on the pages listed below, or by using the keyword search tool below to find specific information within the annual report.-
 1
1 -
2
-
3
-
4
-
5
-
6
-
7
-
8
-
9
-
10
-
11
-
12
-
13
-
14
-
15
-
16
-
17
-
18
-
19
-
20
-
21
-
22
-
23
-
24
-
25
-
26
-
27
-
28
-
29
-
30
-
31
-
32
-
33
-
34
-
35
-
36
-
37
-
38
-
39
-
40
-
41
-
42
-
43
-
44
-
45
-
46
-
47
-
48
-
49
-
50
-
51
-
52
-
53
-
54
-
55
-
56
-
57
-
58
-
59
-
60
-
61
-
62
-
63
-
64
-
 65
65 -
 66
66 -
 67
67 -
 68
68 -
 69
69 -
 70
70 -
 71
71 -
 72
72 -
 73
73 -
 74
74 -
 75
75 -
 76
76 -
 77
77 -
 78
78 -
 79
79 -
 80
80 -
 81
81 -
 82
82
 |
 |

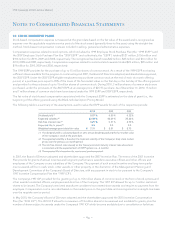
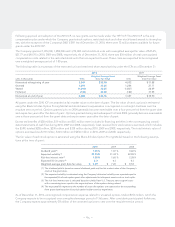
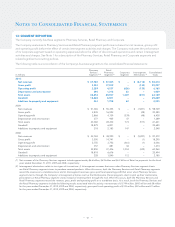
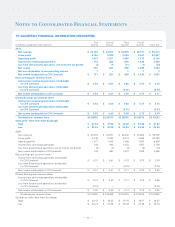
13: SEGMENT REPORTING
The Company currently has three segments: Pharmacy Services, Retail Pharmacy and Corporate.
The Company evaluates its Pharmacy Services and Retail Pharmacy segment performance based on net revenue, gross profit
and operating profit before the effect of certain intersegment activities and charges. The Company evaluates the performance
of its Corporate segment based on operating expenses before the effect of discontinued operations and certain intersegment
activities and charges. See Note 1 for a description of the Pharmacy Services, Retail Pharmacy and Corporate segments and
related significant accounting policies.
The following table is a reconciliation of the Company’s business segments to the consolidated financial statements:
Pharmacy Retail
Services Pharmacy Corporate Intersegment Consolidated
in millions Segment (1) (2) Segment (2) Segment Eliminations (2) Totals
2010:
Net revenues $ 47,780 $ 57,345 $ – $ (8,712) $ 96,413
Gross profit 3,353 17,039 – (135) 20,257
Operating profit 2,389 4,537 (626) (135) 6,165
Depreciation and amortization 390 1,016 63 – 1,469
Total assets 32,254 28,927 1,439 (451) 62,169
Goodwill 18,868 6,801 – – 25,669
Additions to property and equipment 234 1,708 63 – 2,005
2009:
Net revenues $ 51,065 $ 55,355 $ – $ (7,691) $ 98,729
Gross profit 3,835 16,593 – (48) 20,380
Operating profit 2,866 4,159 (539) (48) 6,438
Depreciation and amortization 377 965 47 – 1,389
Total assets 33,082 28,302 774 (517) 61,641
Goodwill 18,879 6,801 – – 25,680
Additions to property and equipment 218 2,183 147 – 2,548
2008:
Net revenues $ 43,769 $ 48,990 $ – $ (5,287) $ 87,472
Gross profit 3,550 14,741 – (1) 18,290
Operating profit 2,755 3,753 (461) (1) 6,046
Depreciation and amortization 357 881 36 – 1,274
Total assets 32,850 27,406 1,053 (349) 60,960
Goodwill 18,818 6,676 – – 25,494
Additions to property and equipment 228 1,840 112 – 2,180
(1) Net revenues of the Pharmacy Services segment include approximately $6.6 billion, $6.9 billion and $6.3 billion of Retail co-payments for the fiscal
years ended December 31, 2010, 2009 and 2008, respectively.
(2) Intersegment eliminations relate to two types of transactions: (i) Intersegment revenues that occur when Pharmacy Services segment clients
use Retail Pharmacy segment stores to purchase covered products. When this occurs, both the Pharmacy Services and Retail Pharmacy segments
record the revenue on a standalone basis and (ii) Intersegment revenues, gross profit and operating profit that occur when Pharmacy Services
segment clients, through the Company’s intersegment activities (such as the Maintenance Choice program), elect to pick up their maintenance
prescriptions at Retail Pharmacy segment stores instead of receiving them through the mail. When this occurs, both the Pharmacy Services and
Retail Pharmacy segments record the revenue, gross profit and operating profit on a standalone basis. As a result, both the Pharmacy Services and
the Retail Pharmacy segments include the following results associated with this activity: net revenues of $1,794 million, $692 million and $8 million
for the years ended December 31, 2010, 2009 and 2008, respectively; gross profit and operating profit of $135 million, $48 million and $1 million
for the years ended December 31, 2010, 2009 and 2008, respectively.
Notes to Consolidated Financial Statements
– 71 –