CVS 2010 Annual Report Download - page 35
Download and view the complete annual report
Please find page 35 of the 2010 CVS annual report below. You can navigate through the pages in the report by either clicking on the pages listed below, or by using the keyword search tool below to find specific information within the annual report.-
 1
1 -
2
-
3
-
4
-
5
-
6
-
7
-
8
-
9
-
10
-
11
-
12
-
13
-
14
-
15
-
16
-
17
-
18
-
19
-
20
-
21
-
22
-
23
-
24
-
 25
25 -
 26
26 -
 27
27 -
 28
28 -
 29
29 -
 30
30 -
 31
31 -
 32
32 -
 33
33 -
 34
34 -
 35
35 -
 36
36 -
 37
37 -
 38
38 -
 39
39 -
 40
40 -
 41
41 -
 42
42 -
 43
43 -
 44
44 -
 45
45 -
46
-
47
-
48
-
49
-
50
-
51
-
52
-
53
-
54
-
55
-
56
-
57
-
58
-
59
-
60
-
61
-
62
-
63
-
64
-
65
-
66
-
67
-
68
-
69
-
70
-
71
-
72
-
73
-
74
-
75
-
76
-
77
-
78
-
79
-
80
-
81
-
82
 |
 |

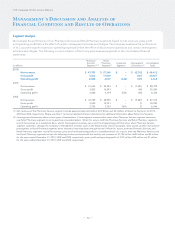
• In conjunction with a class action settlement with two entities that publish the AWP of pharmaceuticals, the AWP for many
brand-name and some generic prescription drugs were reduced effective September 26, 2009. We reached understandings
with virtually all of our commercial third-party payors where we participate as pharmacy providers to adjust reimbursements
to account for this change in methodology, but most state Medicaid programs that utilize AWP as a pricing reference did
not take action to make similar adjustments. Accordingly, state Medicaid reimbursement was adversely impacted in 2010.
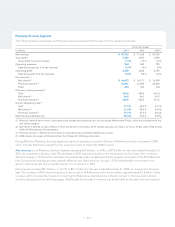
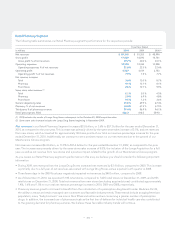
Operating expenses in our Retail Pharmacy Segment include store and administrative payroll, employee benefits, store and
administrative occupancy costs, selling expenses, advertising expenses, administrative expenses and depreciation and amortiza-
tion expense.
Operating expenses increased $68 million, or less than 1%, to $12.5 billion for the year ended December 31, 2010, as compared
to the prior year. Operating expenses as a percentage of net revenues decreased to 21.8% for the year ended December 31,
2010, compared to 22.5% for the prior year. The increase in operating expenses in 2010 was the result of higher store operating
costs associated with our increased store count, partially offset by the absence of costs incurred related to the integration of the
Longs Acquisition.
Operating expenses increased $1.4 billion, or 13.2%, to $12.4 billion for the year ended December 31, 2009, as compared to
the prior year. Operating expenses as a percentage of net revenues increased to 22.5% for the year ended December 31, 2009,
compared to 22.4% for the prior year. The increase in operating expenses in 2009 was the result of higher store operating costs
associated with our increased store count including the Longs Acquisition stores that we owned for a full year in 2009 versus
a partial year in 2008, as well as integration costs associated with the Longs Acquisition, partially offset by a positive impact of
approximately $92 million due to three fewer days in the 2009 fiscal year as compared to 2008.
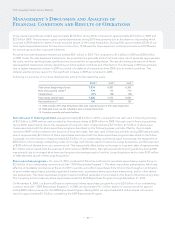
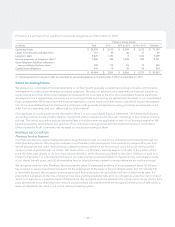
Corporate Segment
Operating expenses increased $87 million, or 16.3% and $78 million, or 16.9% during 2010 and 2009, respectively. Operating
expenses within the Corporate segment include executive management, corporate relations, legal, compliance, human
resources, corporate information technology and finance related costs.
Operating expenses increased during 2010 and 2009 primarily due to higher professional fees, primarily for legal services
associated with increased litigation activity, information technology services associated with enterprise initiatives, compensation
and benefit costs, and depreciation.
Liquidity and Capital Resources
We maintain a level of liquidity sufficient to allow us to cover our cash needs in the short-term. Over the long-term, we manage
our cash and capital structure to maximize shareholder return, strengthen our financial position and maintain flexibility for future
strategic initiatives. We continuously assess our working capital needs, debt and leverage levels, capital expenditure require-
ments, dividend payouts, potential share repurchases and future investments or acquisitions. We believe our operating cash
flows, commercial paper program, sale-leaseback program, as well as any potential future borrowings, will be sufficient to fund
these future payments and long-term initiatives.
Net cash provided by operating activities increased to approximately $4.8 billion in 2010. This compares to approximately
$4.0 billion and $3.9 billion in 2009 and 2008, respectively. The increase in net cash provided by operating activities during 2010
was primarily due to increases in cash receipts from customers, decreases in inventory purchases, partially offset by cash paid
to other suppliers. 2009 includes a full year of net cash provided by operating activities from the Longs Acquisition compared
to 2008. 2008 also includes net cash provided by operating activities from the Longs Acquisition from the acquisition date
(October 20, 2008) forward.
Net cash used in investing activities increased to approximately $1.6 billion in 2010. This compares to approximately $1.1 billion
and $4.6 billion in 2009 and 2008, respectively. The increase in net cash used in investing activities was primarily due to a reduction
in the amount of proceeds received from sale-leaseback transactions, partially offset by less cash used for purchases of property
and equipment. The decrease in net cash used in investing activities in 2009 was primarily due to a reduction in acquisition
activities in 2009 and an increase in sale-leaseback transactions.
– 31 –