CVS 2010 Annual Report Download - page 27
Download and view the complete annual report
Please find page 27 of the 2010 CVS annual report below. You can navigate through the pages in the report by either clicking on the pages listed below, or by using the keyword search tool below to find specific information within the annual report.-
 1
1 -
2
-
3
-
4
-
5
-
6
-
7
-
8
-
9
-
10
-
11
-
12
-
13
-
14
-
15
-
16
-
 17
17 -
 18
18 -
 19
19 -
 20
20 -
 21
21 -
 22
22 -
 23
23 -
 24
24 -
 25
25 -
 26
26 -
 27
27 -
 28
28 -
 29
29 -
 30
30 -
 31
31 -
 32
32 -
 33
33 -
 34
34 -
 35
35 -
 36
36 -
 37
37 -
38
-
39
-
40
-
41
-
42
-
43
-
44
-
45
-
46
-
47
-
48
-
49
-
50
-
51
-
52
-
53
-
54
-
55
-
56
-
57
-
58
-
59
-
60
-
61
-
62
-
63
-
64
-
65
-
66
-
67
-
68
-
69
-
70
-
71
-
72
-
73
-
74
-
75
-
76
-
77
-
78
-
79
-
80
-
81
-
82
 |
 |

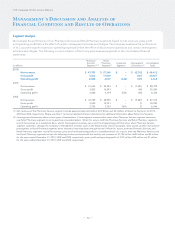
Operating expenses increased $151 million and $1.7 billion during 2010 and 2009, respectively. As you review our performance
in this area, we believe you should consider the following important information:
• During 2010, operating expenses increased as a result of increases in our Corporate segment expenses of $87 million, and
an increase in our Retail Pharmacy segment expenses of $68 million, partially offset by a decrease in our Pharmacy Services
segment expenses of $5 million, compared to the prior year.
• During 2009, the Longs Acquisition increased operating expenses by $1.0 billion, but positively impacted our operating
expense rate as a percentage of net revenues compared to 2008.
• Three fewer days in the 2009 fiscal year, positively impacted operating expenses by $97 million, compared to 2008.
• The results of 2008 include operating expenses from the Longs Drug Stores and RxAmerica from the acquisition date (October 20,
2008) forward.
Please see the Segment Analysis later in this document for additional information about operating expenses.
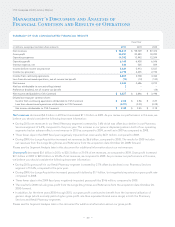
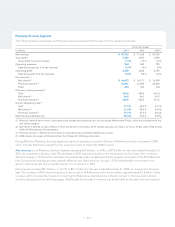
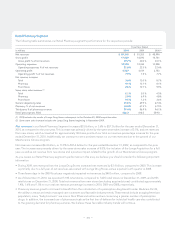
Interest expense, net consisted of the following:
in millions 2010 2009 2008
Interest expense $ 539 $ 530 $ 530
Interest income (3) (5) (21)
Interest expense, net $ 536 $ 525 $ 509
During 2010, net interest expense increased by $11 million, to $536 million compared to 2009, due to an increase in our average
debt balances and average interest rates. During 2009, net interest expense increased by $16 million, compared to 2008, due to
lower interest income associated with our temporary investments.
Income tax provision – Our effective income tax rate was 38.9% in 2010, 37.3% in 2009 and 39.6% in 2008. The annual fluctuations
in our effective income tax rate are primarily related to changes in permanent items, state income tax expense and the recogni-
tion of previously unrecognized tax benefits relating to the expiration of various statutes of limitation and settlements with tax
authorities. In 2010 we recognized a $47 million income tax benefit related to the expiration of various statutes of limitation and
settlements with tax authorities. Similarly, in 2009 we recognized a $167 million income tax benefit relating to the expiration of
various statutes of limitation and settlements with tax authorities.
Income from continuing operations decreased $269 million or 7.2% to $3.4 billion in 2010. This compares to $3.7 billion in
2009 and $3.3 billion in 2008. As previously noted, income from continuing operations in 2010 and 2009 both benefited from
previously unrecognized tax benefit.
Loss from discontinued operations – In connection with certain business dispositions completed between 1991 and 1997,
the Company continues to guarantee store lease obligations for a number of former subsidiaries, including Linens ‘n Things.
On May 2, 2008, Linens Holding Co. and certain affiliates, which operate Linens ‘n Things, filed voluntary petitions under
Chapter 11 of the United States Bankruptcy Code in the United States Bankruptcy Court for the District of Delaware. The
Company’s loss from discontinued operations includes lease-related costs of $15 million ($24 million, net of a $9 million income
tax benefit), $12 million ($19 million, net of a $7 million income tax benefit) and $132 million ($214 million, net of an $82 million
income tax benefit) in 2010, 2009 and 2008, respectively.
Net loss attributable to noncontrolling interest represents the minority shareholders’ portion of the net loss from our majority
owned subsidiary, Generation Health, Inc., which we acquired late in the fourth quarter of 2009. The net loss attributable to
noncontrolling interest for the year ended December 31, 2010 was $3 million and was de minimis in 2009.
Net income attributable to CVS Caremark decreased $269 million or 7.3% to $3.4 billion (or $2.49 per diluted share) in 2010.
This compares to $3.7 billion (or $2.55 per diluted share) in 2009 and $3.2 billion (or $2.18 per diluted share) in 2008. As previously
noted, net income attributable to CVS Caremark in 2010 and 2009 both benefited from previously unrecognized tax benefit.
– 23 –