Bed, Bath and Beyond 2015 Annual Report Download - page 99
Download and view the complete annual report
Please find page 99 of the 2015 Bed, Bath and Beyond annual report below. You can navigate through the pages in the report by either clicking on the pages listed below, or by using the keyword search tool below to find specific information within the annual report.-
 1
1 -
2
-
3
-
4
-
5
-
6
-
7
-
8
-
9
-
10
-
11
-
12
-
13
-
14
-
15
-
16
-
17
-
18
-
19
-
20
-
21
-
22
-
23
-
24
-
25
-
26
-
27
-
28
-
29
-
30
-
31
-
32
-
33
-
34
-
35
-
36
-
37
-
38
-
39
-
40
-
41
-
42
-
43
-
44
-
45
-
46
-
47
-
48
-
49
-
50
-
51
-
52
-
53
-
54
-
55
-
56
-
57
-
58
-
59
-
60
-
61
-
62
-
63
-
64
-
65
-
66
-
67
-
68
-
69
-
70
-
71
-
72
-
73
-
74
-
75
-
76
-
77
-
78
-
79
-
80
-
81
-
82
-
83
-
84
-
85
-
86
-
87
-
88
-
 89
89 -
 90
90 -
 91
91 -
 92
92 -
 93
93 -
 94
94 -
 95
95 -
 96
96 -
 97
97 -
 98
98 -
 99
99 -
 100
100 -
 101
101 -
 102
102 -
 103
103 -
 104
104
 |
 |

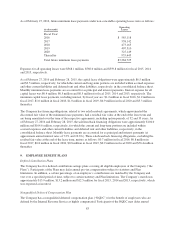
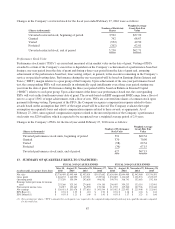
Changes in the Company’s restricted stock for the fiscal year ended February 27, 2016 were as follows:
(Shares in thousands)
Number of Restricted
Shares
Weighted Average
Grant-Date Fair
Value
Unvested restricted stock, beginning of period 3,592 $57.90
Granted 792 68.67
Vested (952) 49.50
Forfeited (202) 62.81
Unvested restricted stock, end of period 3,230 $62.71
Performance Stock Units
Performance stock units (“PSUs”) are issued and measured at fair market value on the date of grant. Vesting of PSUs
awarded to certain of the Company’s executives is dependent on the Company’s achievement of a performance-based test
during a one-year period from the date of grant and during a three-year period from the date of grant and, assuming
achievement of the performance-based test, time vesting, subject, in general, to the executive remaining in the Company’s
service on specified vesting dates. Performance during the one-year period will be based on Earnings Before Interest and
Taxes (“EBIT”) margin relative to a peer group of the Company. Upon achievement of the one-year performance-based
test, the corresponding PSUs will vest annually in substantially equal installments over a three year period starting one
year from the date of grant. Performance during the three-year period will be based on Return on Invested Capital
(“ROIC”) relative to such peer group. Upon achievement of the three-year performance-based test, the corresponding
PSUs will vest on the fourth anniversary date of grant. The awards based on EBIT margin and ROIC range from a floor of
zero to a cap of 150% of target achievement, with a floor of zero. PSUs are converted into shares of common stock upon
payment following vesting. Upon grant of the PSUs, the Company recognizes compensation expense related to these
awards based on the assumption that 100% of the target award will be achieved. The Company evaluates the target
assumption on a quarterly basis and adjusts compensation expense related to these awards, as appropriate. As of
February 27, 2016, unrecognized compensation expense related to the unvested portion of the Company’s performance
stock units was $20.6 million, which is expected to be recognized over a weighted average period of 2.0 years.
Changes in the Company’s PSUs for the fiscal year ended February 27, 2016 were as follows:
(Shares in thousands)
Number of Performance
Stock Units
Weighted Average
Grant-Date Fair
Value
Unvested performance stock units, beginning of period 391 $62.34
Granted 370 70.96
Vested (98) 62.34
Forfeited (36) 67.15
Unvested performance stock units, end of period 627 $67.15
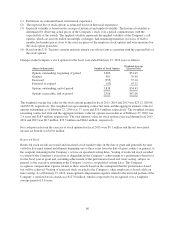
13. SUMMARY OF QUARTERLY RESULTS (UNAUDITED)
FISCAL 2015 QUARTER ENDED FISCAL 2014 QUARTER ENDED
(in thousands, except per share data)
May 30,
2015
August 29,
2015
November 28,
2015
February 27,
2016
May 31,
2014
August 30,
2014
November 29,
2014
February 28,
2015
Net sales $2,738,495 $2,995,469 $2,952,031 $3,417,892 $2,656,698 $2,944,905 $2,942,980 $3,336,593
Gross profit 1,044,133 1,140,950 1,115,311 1,319,916 1,030,885 1,134,045 1,128,974 1,325,875
Operating profit 273,269 350,194 292,858 498,582 300,701 368,741 352,683 532,168
Earnings before provision for income
taxes 253,368 325,141 274,806 474,130 298,607 359,213 333,114 512,901
Provision for income taxes 94,917 123,463 96,990 170,586 111,555 135,260 107,706 191,840
Net earnings $ 158,451 $ 201,678 $ 177,816 $ 303,544 $ 187,052 $ 223,953 $ 225,408 $ 321,061
EPS-Basic (1) $ 0.94 $ 1.22 $ 1.10 $ 1.93 $ 0.94 $ 1.18 $ 1.24 $ 1.83
EPS-Diluted (1) $ 0.93 $ 1.21 $ 1.09 $ 1.91 $ 0.93 $ 1.17 $ 1.23 $ 1.80
(1) Net earnings per share (“EPS”) amounts for each quarter are required to be computed independently and may not equal the amount computed
for the total year.
87