Bed, Bath and Beyond 2015 Annual Report Download - page 102
Download and view the complete annual report
Please find page 102 of the 2015 Bed, Bath and Beyond annual report below. You can navigate through the pages in the report by either clicking on the pages listed below, or by using the keyword search tool below to find specific information within the annual report.-
 1
1 -
2
-
3
-
4
-
5
-
6
-
7
-
8
-
9
-
10
-
11
-
12
-
13
-
14
-
15
-
16
-
17
-
18
-
19
-
20
-
21
-
22
-
23
-
24
-
25
-
26
-
27
-
28
-
29
-
30
-
31
-
32
-
33
-
34
-
35
-
36
-
37
-
38
-
39
-
40
-
41
-
42
-
43
-
44
-
45
-
46
-
47
-
48
-
49
-
50
-
51
-
52
-
53
-
54
-
55
-
56
-
57
-
58
-
59
-
60
-
61
-
62
-
63
-
64
-
65
-
66
-
67
-
68
-
69
-
70
-
71
-
72
-
73
-
74
-
75
-
76
-
77
-
78
-
79
-
80
-
81
-
82
-
83
-
84
-
85
-
86
-
87
-
88
-
89
-
90
-
91
-
 92
92 -
 93
93 -
 94
94 -
 95
95 -
 96
96 -
 97
97 -
 98
98 -
 99
99 -
 100
100 -
 101
101 -
 102
102 -
 103
103 -
 104
104
 |
 |
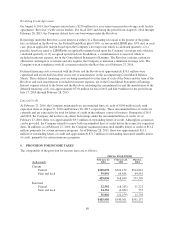
MANAGEMENT’S REPORT ON INTERNAL CONTROL OVER FINANCIAL REPORTING
Our management is responsible for establishing and maintaining adequate internal control over financial
reporting (as defined in Rule 13a-15(f) under the Securities Exchange Act of 1934, as amended). Our
management assessed the effectiveness of our internal control over financial reporting as of February 27, 2016.
In making this assessment, our management used the criteria set forth by the Committee of Sponsoring
Organizations of the Treadway Commission (“COSO”), released in 2013, Internal Control-Integrated
Framework.
Our management has concluded that, as of February 27, 2016, our internal control over financial reporting is
effective based on these criteria.
April 26, 2016
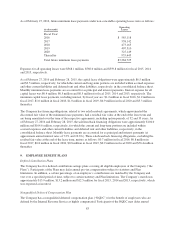
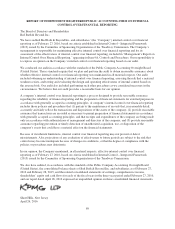
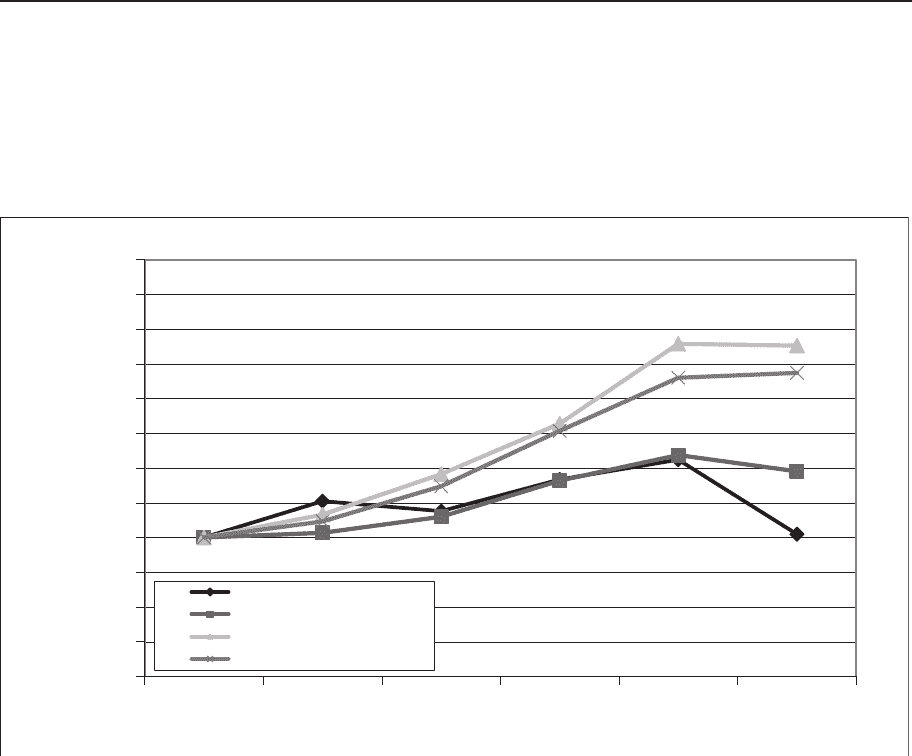
STOCK PRICE PERFORMANCE GRAPH
The graph shown below compares the performance of the Company’s common stock with that of the S&P 500
Index, the S&P Specialty Retail Index and the S&P Retail Composite Index over the same period (assuming the
investment of $100 in the Company’s common stock and each of the three Indexes on February 26, 2011, and the
reinvestment of dividends, if any).
-
25
50
75
100
125
150
175
200
225
250
275
300
2/26/11 2/25/12 3/2/13 3/1/14 2/28/15 2/27/16
DOLLARS
Bed Bath & Beyond Inc.
S&P 500 Index
S&P Specialty Retail Index
S&P Retail Composite Index
90