Bed, Bath and Beyond 2015 Annual Report Download - page 70
Download and view the complete annual report
Please find page 70 of the 2015 Bed, Bath and Beyond annual report below. You can navigate through the pages in the report by either clicking on the pages listed below, or by using the keyword search tool below to find specific information within the annual report.-
 1
1 -
2
-
3
-
4
-
5
-
6
-
7
-
8
-
9
-
10
-
11
-
12
-
13
-
14
-
15
-
16
-
17
-
18
-
19
-
20
-
21
-
22
-
23
-
24
-
25
-
26
-
27
-
28
-
29
-
30
-
31
-
32
-
33
-
34
-
35
-
36
-
37
-
38
-
39
-
40
-
41
-
42
-
43
-
44
-
45
-
46
-
47
-
48
-
49
-
50
-
51
-
52
-
53
-
54
-
55
-
56
-
57
-
58
-
59
-
 60
60 -
 61
61 -
 62
62 -
 63
63 -
 64
64 -
 65
65 -
 66
66 -
 67
67 -
 68
68 -
 69
69 -
 70
70 -
 71
71 -
 72
72 -
 73
73 -
 74
74 -
 75
75 -
 76
76 -
 77
77 -
 78
78 -
 79
79 -
 80
80 -
81
-
82
-
83
-
84
-
85
-
86
-
87
-
88
-
89
-
90
-
91
-
92
-
93
-
94
-
95
-
96
-
97
-
98
-
99
-
100
-
101
-
102
-
103
-
104
 |
 |
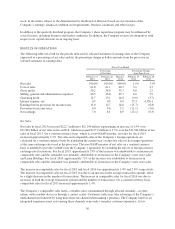
Operating Profit
Operating profit for fiscal 2015 was $1.415 billion or 11.7% of net sales, $1.554 billion or 13.1% of net sales in
fiscal 2014 and $1.615 billion or 14.0% of net sales in fiscal 2013. The changes in operating profit as a
percentage of net sales between fiscal 2015 and 2014 and between fiscal 2014 and 2013 were the result of the
changes in gross profit margin and SG&A as a percentage of net sales as described above.
The Company believes operating margin compression is likely to continue in fiscal 2016 as a result of several
items, including increases in, as a percentage of net sales, coupon expense, net direct to customer shipping
expense, additional payroll start-up costs associated with the opening of the Company’s Lewisville, Texas
distribution facility, investments in compensation and benefits, and technology-related expenses, including
depreciation related to the Company’s ongoing investments. In addition, the year-over-year comparison of
operating margin will be impacted by the non-recurring benefit relating to the state audit settlement which
occurred in fiscal 2015.
Interest Expense, net
Interest expense, net was $87.5 million, $50.5 million and $1.1 million in fiscal 2015, 2014 and 2013,
respectively. For fiscal 2015 and fiscal 2014, interest expense, net primarily related to interest on the senior
unsecured notes issued in July 2014.
Income Taxes
The effective tax rate was 36.6% for fiscal 2015, 36.3% for fiscal 2014 and 36.6% for fiscal 2013. For fiscal
2015 and fiscal 2013, the tax rate included net benefits of approximately $14.8 million and $20.0 million,
respectively, primarily due to the recognition of favorable discrete state tax items. For fiscal 2014, the tax rate
included net benefits of approximately $20.0 million, primarily due to the recognition of favorable discrete
federal and state tax items.
Potential volatility in the effective tax rate from year to year may occur as the Company is required each year to
determine whether new information changes the assessment of both the probability that a tax position will
effectively be sustained and the appropriateness of the amount of recognized benefit.
GROWTH
The Company strives to do more for and with its customers by: offering an extensive breadth and depth of
differentiated assortment of merchandise at the right value; presenting merchandise in a distinctive manner
designed to maximize customer convenience and reinforce customer perception of a wide selection; and
providing excellent customer service, including new products, services and solutions. The Company is pursuing
its growth objectives by investing in its omnichannel capabilities, optimizing its store operations and market
coverage, including international expansion; leveraging its combined expertise and product knowledge to provide
products and services to hospitality, travel and other institutional customers; and continuously reviewing
opportunities for strategic acquisitions.
The Company continues to expand, differentiate and leverage its merchandise assortment across all channels,
concepts and countries in which it operates, to better engage with its customers wherever, whenever and however
they express their life interests and travel through their life stages. Through its growing analytic capabilities and
omnichannel marketing approaches, the Company strives to more efficiently and effectively understand and
satisfy its customers’ needs.
As of February 27, 2016, the Company operated 1,530 stores plus its various websites, other interactive
platforms and distribution facilities. The Company’s 1,530 stores operate in all 50 states, the District of
58