Bed, Bath and Beyond 2015 Annual Report Download - page 69
Download and view the complete annual report
Please find page 69 of the 2015 Bed, Bath and Beyond annual report below. You can navigate through the pages in the report by either clicking on the pages listed below, or by using the keyword search tool below to find specific information within the annual report.-
 1
1 -
2
-
3
-
4
-
5
-
6
-
7
-
8
-
9
-
10
-
11
-
12
-
13
-
14
-
15
-
16
-
17
-
18
-
19
-
20
-
21
-
22
-
23
-
24
-
25
-
26
-
27
-
28
-
29
-
30
-
31
-
32
-
33
-
34
-
35
-
36
-
37
-
38
-
39
-
40
-
41
-
42
-
43
-
44
-
45
-
46
-
47
-
48
-
49
-
50
-
51
-
52
-
53
-
54
-
55
-
56
-
57
-
58
-
 59
59 -
 60
60 -
 61
61 -
 62
62 -
 63
63 -
 64
64 -
 65
65 -
 66
66 -
 67
67 -
 68
68 -
 69
69 -
 70
70 -
 71
71 -
 72
72 -
 73
73 -
 74
74 -
 75
75 -
 76
76 -
 77
77 -
 78
78 -
 79
79 -
80
-
81
-
82
-
83
-
84
-
85
-
86
-
87
-
88
-
89
-
90
-
91
-
92
-
93
-
94
-
95
-
96
-
97
-
98
-
99
-
100
-
101
-
102
-
103
-
104
 |
 |
examples are: a customer may be assisted by an in-store associate to create a wedding or baby registry, while the
guests may ultimately purchase a gift from the Company’s websites; or, a customer may research a particular
item, and read other customer reviews on the Company’s websites before visiting a store to consummate the
actual purchase; or a customer may reserve an item online for in-store pick up; or while in a store, a customer
may make the purchase on a mobile device for in home delivery from either a distribution facility, a store or
directly from a vendor. In addition, the Company accepts returns in-store without regard to the channel in which
the purchase was consummated, therefore resulting in reducing store sales by sales originally consummated
through customer facing online websites and mobile applications. As the Company’s retail operations are
integrated and it cannot reasonably track the channel in which the ultimate sale is initiated, the Company can
however provide directional information on where the sale was consummated.
For fiscal 2015, comparable sales consummated through customer facing online websites and mobile applications
increased in excess of 25% over the corresponding period in the prior year, while comparable sales consummated
in-store declined approximately 1% over the corresponding period in the prior year. For fiscal 2014, comparable
sales consummated through customer facing online websites and mobile applications increased in excess of 50%,
over the corresponding period in the prior year, while comparable sales consummated in-store were relatively flat
to the corresponding period in the prior year.
Comparable sales represented $11.723 billion, $11.517 billion and $10.661 billion of net sales for fiscal 2015,
2014 and 2013, respectively.
Sales of domestics merchandise accounted for approximately 35.9%, 35.9% and 36.1% of net sales in fiscal
2015, 2014 and 2013, respectively, of which the Company estimates that bed linens accounted for approximately
12% of net sales in fiscal 2015, fiscal 2014 and fiscal 2013, respectively. The remaining net sales in fiscal 2015,
2014 and 2013 of 64.1%, 64.1% and 63.9%, respectively, represented sales of home furnishings. No other
individual product category accounted for 10% or more of net sales during fiscal 2015, 2014 or 2013.
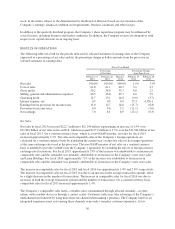
Gross Profit
Gross profit in fiscal 2015, 2014 and 2013 was $4.620 billion or 38.2% of net sales, $4.620 billion or 38.9% of
net sales and $4.566 billion or 39.7% of net sales, respectively. The decrease in the gross profit margin as a
percentage of net sales between fiscal 2015 and 2014 was primarily attributed to a decrease in merchandise
margin. Also contributing were increases in coupon expense, resulting from an increase in redemptions and a
slight increase in the average coupon amount, and net direct to customer shipping expense. The decrease in the
gross profit margin as a percentage of net sales between fiscal 2014 and 2013 was primarily attributed to an
increase in coupon expense resulting from an increase in redemptions, partially offset by a slight decrease in the
average coupon amount, and an increase in net direct to customer shipping expense, which was impacted by a
reduction in the bedbathandbeyond.com free shipping threshold. The one year anniversary of the
bedbathandbeyond.com free shipping threshold occurred in February 2015.
Selling, General and Administrative Expenses
SG&A was $3.205 billion or 26.5% of net sales in fiscal 2015, $3.065 billion or 25.8% of net sales in fiscal 2014
and $2.951 billion or 25.7% of net sales in fiscal 2013. The percentage of net sales increase in SG&A between
fiscal 2015 and 2014 was primarily due to, in order of magnitude, increased technology expenses and related
depreciation and increased advertising expenses, due in part to the growth in digital advertising. The percentage
of net sales increase in SG&A between fiscal 2014 and 2013 was primarily due to increased technology expenses
and related depreciation and increased advertising expenses, partially offset by relative decreases in payroll and
payroll related items (including salaries), occupancy expenses (including rent) and the year over year net benefits
of certain non-recurring items, primarily relating to credit card fee litigation in the fiscal third quarter of 2014.
The increase in technology expenses and related depreciation, as a percentage of net sales, represented
approximately 30 basis points for fiscal 2014 as compared to the same period in the prior year.
57