Bed, Bath and Beyond 2015 Annual Report Download - page 68
Download and view the complete annual report
Please find page 68 of the 2015 Bed, Bath and Beyond annual report below. You can navigate through the pages in the report by either clicking on the pages listed below, or by using the keyword search tool below to find specific information within the annual report.-
 1
1 -
2
-
3
-
4
-
5
-
6
-
7
-
8
-
9
-
10
-
11
-
12
-
13
-
14
-
15
-
16
-
17
-
18
-
19
-
20
-
21
-
22
-
23
-
24
-
25
-
26
-
27
-
28
-
29
-
30
-
31
-
32
-
33
-
34
-
35
-
36
-
37
-
38
-
39
-
40
-
41
-
42
-
43
-
44
-
45
-
46
-
47
-
48
-
49
-
50
-
51
-
52
-
53
-
54
-
55
-
56
-
57
-
 58
58 -
 59
59 -
 60
60 -
 61
61 -
 62
62 -
 63
63 -
 64
64 -
 65
65 -
 66
66 -
 67
67 -
 68
68 -
 69
69 -
 70
70 -
 71
71 -
 72
72 -
 73
73 -
 74
74 -
 75
75 -
 76
76 -
 77
77 -
 78
78 -
79
-
80
-
81
-
82
-
83
-
84
-
85
-
86
-
87
-
88
-
89
-
90
-
91
-
92
-
93
-
94
-
95
-
96
-
97
-
98
-
99
-
100
-
101
-
102
-
103
-
104
 |
 |

stock, in the future, subject to the determination by the Board of Directors based on an evaluation of the
Company’s earnings, financial condition and requirements, business conditions and other factors.
In addition to the quarterly dividend program, the Company’s share repurchase program may be influenced by
several factors, including business and market conditions. In addition, the Company reviews its alternatives with
respect to its capital structure on an ongoing basis.
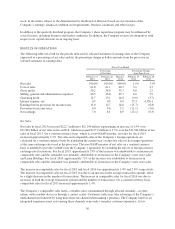
RESULTS OF OPERATIONS
The following table sets forth for the periods indicated (i) selected statement of earnings data of the Company
expressed as a percentage of net sales and (ii) the percentage change in dollar amounts from the prior year in
selected statement of earnings data:
Fiscal Year Ended
Percentage
of Net Sales
Percentage Change
from Prior Year
February 27,
2016
February 28,
2015
March 1,
2014
February 27,
2016
February 28,
2015
Net sales 100.0% 100.0% 100.0% 1.9% 3.3%
Cost of sales 61.8 61.1 60.3 3.1 4.7
Gross profit 38.2 38.9 39.7 0.0 1.2
Selling, general and administrative expenses 26.5 25.8 25.7 4.6 3.9
Operating profit 11.7 13.1 14.0 (9.0) (3.7)
Interest expense, net 0.7 0.4 0.0 73.3 4,326.1
Earnings before provision for income taxes 11.0 12.7 14.0 (11.7) (6.8)
Provision for income taxes 4.0 4.6 5.1 (11.1) (7.6)
Net earnings 7.0 8.1 8.9 (12.1) (6.3)
Net Sales
Net sales in fiscal 2015 increased $222.7 million to $12.104 billion, representing an increase of 1.9% over
$11.881 billion of net sales in fiscal 2014, which increased $377.2 million or 3.3% over the $11.504 billion of net
sales in fiscal 2013. On a constant currency basis, which is a non-GAAP measure, net sales for fiscal 2015
increased approximately 2.3%. Net sales and comparable sales of the Company’s foreign operations are
calculated on a constant currency basis by translating the current year’s respective sales of its foreign operations
at the same exchange rates used in the prior year. The non-GAAP measure of net sales on a constant currency
basis is intended to provide visibility into the Company’s operations by excluding the effects of foreign currency
exchange rate fluctuations. For fiscal 2015, approximately 55% of the increase was attributable to an increase in
comparable sales and the remainder was primarily attributable to an increase in the Company’s new store sales
and Linen Holdings. For fiscal 2014, approximately 71% of the increase was attributable to an increase in
comparable sales and the remainder was primarily attributable to an increase in the Company’s new store sales.
The increase in comparable sales for fiscal 2015 and fiscal 2014 was approximately 1.0% and 2.4%, respectively.
The increase in comparable sales for fiscal 2015 was due to an increase in the average transaction amount, offset
by a slight decrease in the number of transactions. The increase in comparable sales for fiscal 2014 was due to
increases in both the average transaction amount and the number of transactions. On a constant currency basis,
comparable sales for fiscal 2015 increased approximately 1.4%.
The Company’s comparable sales metric considers sales consummated through all retail channels – in-store,
online, with a mobile device or through a contact center. Customers today may take advantage of the Company’s
omnichannel environment by using more than one channel when making a purchase. The Company believes an
integrated experience must exist among these channels to provide a seamless customer experience. A few
56