Bed, Bath and Beyond 2015 Annual Report Download - page 82
Download and view the complete annual report
Please find page 82 of the 2015 Bed, Bath and Beyond annual report below. You can navigate through the pages in the report by either clicking on the pages listed below, or by using the keyword search tool below to find specific information within the annual report.-
 1
1 -
2
-
3
-
4
-
5
-
6
-
7
-
8
-
9
-
10
-
11
-
12
-
13
-
14
-
15
-
16
-
17
-
18
-
19
-
20
-
21
-
22
-
23
-
24
-
25
-
26
-
27
-
28
-
29
-
30
-
31
-
32
-
33
-
34
-
35
-
36
-
37
-
38
-
39
-
40
-
41
-
42
-
43
-
44
-
45
-
46
-
47
-
48
-
49
-
50
-
51
-
52
-
53
-
54
-
55
-
56
-
57
-
58
-
59
-
60
-
61
-
62
-
63
-
64
-
65
-
66
-
67
-
68
-
69
-
70
-
71
-
 72
72 -
 73
73 -
 74
74 -
 75
75 -
 76
76 -
 77
77 -
 78
78 -
 79
79 -
 80
80 -
 81
81 -
 82
82 -
 83
83 -
 84
84 -
 85
85 -
 86
86 -
 87
87 -
 88
88 -
 89
89 -
 90
90 -
 91
91 -
 92
92 -
93
-
94
-
95
-
96
-
97
-
98
-
99
-
100
-
101
-
102
-
103
-
104
 |
 |

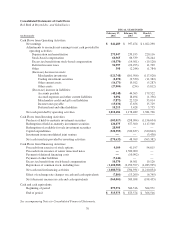
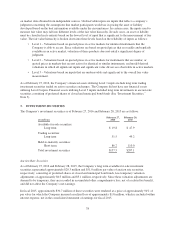
Consolidated Statements of Cash Flows
Bed Bath & Beyond Inc. and Subsidiaries
FISCAL YEAR ENDED
(in thousands)
February 27,
2016
February 28,
2015
March 1,
2014
Cash Flows from Operating Activities:
Net earnings $ 841,489 $ 957,474 $ 1,022,290
Adjustments to reconcile net earnings to net cash provided by
operating activities:
Depreciation and amortization 273,947 239,193 220,116
Stock-based compensation 66,965 66,539 56,244
Excess tax benefit from stock-based compensation (10,370) (14,561) (19,126)
Deferred income taxes 56,997 (22,295) 11,729
Other 398 (2,244) (1,784)
(Increase) decrease in assets:
Merchandise inventories (121,748) (161,506) (117,926)
Trading investment securities (2,270) (9,530) (11,382)
Other current assets (16,171) 19,012 (5,287)
Other assets (27,904) (254) (3,812)
(Decrease) increase in liabilities:
Accounts payable (48,148) 44,563 179,522
Accrued expenses and other current liabilities 6,694 18,494 (1,336)
Merchandise credit and gift card liabilities (7,872) 22,520 33,014
Income taxes payable (15,036) 17,656 15,729
Deferred rent and other liabilities 15,213 3,428 3,735
Net cash provided by operating activities 1,012,184 1,178,489 1,381,726
Cash Flows from Investing Activities:
Purchase of held-to-maturity investment securities (103,017) (298,094) (1,156,634)
Redemption of held-to-maturity investment securities 126,875 677,500 1,117,500
Redemption of available-for-sale investment securities 28,905 ——
Capital expenditures (328,395) (330,637) (320,812)
Investment in unconsolidated joint venture —— (3,436)
Net cash (used in) provided by investing activities (275,632) 48,769 (363,382)
Cash Flows from Financing Activities:
Proceeds from exercise of stock options 9,109 41,197 54,815
Proceeds from issuance of senior unsecured notes —1,500,000 —
Payment of deferred financing costs —(10,092) —
Payment of other liabilities (7,646) ——
Excess tax benefit from stock-based compensation 10,370 14,561 19,126
Repurchase of common stock, including fees (1,100,585) (2,250,597) (1,283,995)
Net cash used in financing activities (1,088,752) (704,931) (1,210,054)
Effect of exchange rate changes on cash and cash equivalents (7,801) (13,269) (6,745)
Net (decrease) increase in cash and cash equivalents (360,001) 509,058 (198,455)
Cash and cash equivalents:
Beginning of period 875,574 366,516 564,971
End of period $ 515,573 $ 875,574 $ 366,516
See accompanying Notes to Consolidated Financial Statements.
70