Bed, Bath and Beyond 2015 Annual Report Download - page 36
Download and view the complete annual report
Please find page 36 of the 2015 Bed, Bath and Beyond annual report below. You can navigate through the pages in the report by either clicking on the pages listed below, or by using the keyword search tool below to find specific information within the annual report.-
 1
1 -
2
-
3
-
4
-
5
-
6
-
7
-
8
-
9
-
10
-
11
-
12
-
13
-
14
-
15
-
16
-
17
-
18
-
19
-
20
-
21
-
22
-
23
-
24
-
25
-
 26
26 -
 27
27 -
 28
28 -
 29
29 -
 30
30 -
 31
31 -
 32
32 -
 33
33 -
 34
34 -
 35
35 -
 36
36 -
 37
37 -
 38
38 -
 39
39 -
 40
40 -
 41
41 -
 42
42 -
 43
43 -
 44
44 -
 45
45 -
 46
46 -
47
-
48
-
49
-
50
-
51
-
52
-
53
-
54
-
55
-
56
-
57
-
58
-
59
-
60
-
61
-
62
-
63
-
64
-
65
-
66
-
67
-
68
-
69
-
70
-
71
-
72
-
73
-
74
-
75
-
76
-
77
-
78
-
79
-
80
-
81
-
82
-
83
-
84
-
85
-
86
-
87
-
88
-
89
-
90
-
91
-
92
-
93
-
94
-
95
-
96
-
97
-
98
-
99
-
100
-
101
-
102
-
103
-
104
 |
 |

PROPOSAL 3—APPROVAL, BY NON-BINDING VOTE, OF 2015 EXECUTIVE COMPENSATION
Equity Compensation
PSUs
In early fiscal 2014, the Company significantly redesigned its equity incentive program for its Named Executive Officers and
certain other key executives with a view toward creating an enhanced link between pay and performance, providing
performance metrics fundamental to the business, and aligning with shareholder value creation. The redesigned program
eliminated the prior performance test and created a new framework consisting of a one-year performance test based on EBIT
margin relative to a peer group and a three-year performance test based on ROIC relative to such peer group. Payouts under
the performance goals were contingent upon achievement of various levels of EBIT margin and ROIC as well as the continued
performance of services by the executives. The 2014 and 2015 awards were in the form of PSUs, of which 75% were subject
to the one-year EBIT margin goal and 25% were subject to the three-year ROIC goal (subsequently changed for fiscal 2016 to
50% for each of the one-year goal and three-year goal, increasing the weighting of the three-year goal). The Compensation
Committee believed it appropriate to set a target based upon EBIT margin when compared to a retail industry peer group, to
incentivize continued operational and fiscal discipline as management executes against the Company’s strategic goals. The
Compensation Committee also believed that, as a relative measure compared to a retail industry peer group, ROIC over a
three-year period provides a suitable metric to measure how the Company’s investments are returning value to the enterprise.
The Compensation Committee believes that these goals are an appropriate measure of performance for companies in the
retail industry and, specifically, for companies in the Company’s sector.
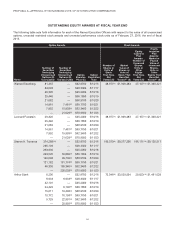
The following table sets forth the achievement ranges for the one-year relative EBIT margin goal and the three-year relative
ROIC goal in place for fiscal 2015, together with the associated payout percentages and vesting schedule. As shown in the
table, the awards range from a floor of zero to a cap of 150% of target achievement.
PSUs Subject to One-Year EBIT Goal for 2015
(75% Weighting)
PSUs Subject to Three-Year ROIC Goal for 2015
(25% Weighting)
Vesting : 1/3 year 1, 1/3 year 2, 1/3 year 3 Vesting : 100% year 4
Achievement
Percentage (% of Peer
Group Average)
Payment Percentage of
Common Stock
Underlying PSUs
Achievement
Percentage (% of Peer
Group Average)
Payment Percentage of
Common Stock
Underlying PSUs
200% or Greater 150% 180% or Greater 150%
185-199% 110% 165-179% 110%
125-184% 100% 80-164% 100%
100-124% 90% 70-79% 90%
80-99% 75% 60-69% 75%
70-79% 50% 50-59% 50%
60-69% 25% 40-49% 25%
<60% 0% <40% 0%
The metrics with respect to each peer group member necessary to measure the performance criteria are based on data
reported in the S&P Capital IQ Database to the extent publicly available, and to the extent such data is not publicly available,
are based on information otherwise publicly available.
The PSUs are not transferable, cannot be pledged, assigned or otherwise disposed of and are subject to the terms of the
Company’s 2012 Incentive Compensation Plan.
The overall approach to equity compensation in fiscal 2015 for all executive officers, including the Named Executive Officers,
and for certain other executives was to combine the performance-based PSU awards with stock options. In determining the
allocation between these two forms of equity awards, the Company considered the retention component and the role of the
executive in the enhancement of shareholder value. For fiscal 2015, the Company allocated at least two-thirds of the value of
equity compensation granted to all executive officers, including the Named Executive Officers, to PSU awards and no greater
than one-third of such value to stock option awards. The vesting provisions relating to equity compensation have been and
continue to be determined with a principal purpose of retaining the Company’s executives and key associates. The Company
believes its equity compensation program promotes the long-term retention of its executives and key associates, including its
Named Executive Officers and in large measure directly aligns compensation of its Named Executive Officers with Company
performance.
The Company believes that the performance-based tests described above meet the standard for performance-based
compensation under Section 162(m) of the Code, so that the PSU awards are intended to be deductible compensation by the
Company for certain executives if their annual compensation exceeds $1 million.
26