Bed, Bath and Beyond 2015 Annual Report Download - page 78
Download and view the complete annual report
Please find page 78 of the 2015 Bed, Bath and Beyond annual report below. You can navigate through the pages in the report by either clicking on the pages listed below, or by using the keyword search tool below to find specific information within the annual report.-
 1
1 -
2
-
3
-
4
-
5
-
6
-
7
-
8
-
9
-
10
-
11
-
12
-
13
-
14
-
15
-
16
-
17
-
18
-
19
-
20
-
21
-
22
-
23
-
24
-
25
-
26
-
27
-
28
-
29
-
30
-
31
-
32
-
33
-
34
-
35
-
36
-
37
-
38
-
39
-
40
-
41
-
42
-
43
-
44
-
45
-
46
-
47
-
48
-
49
-
50
-
51
-
52
-
53
-
54
-
55
-
56
-
57
-
58
-
59
-
60
-
61
-
62
-
63
-
64
-
65
-
66
-
67
-
 68
68 -
 69
69 -
 70
70 -
 71
71 -
 72
72 -
 73
73 -
 74
74 -
 75
75 -
 76
76 -
 77
77 -
 78
78 -
 79
79 -
 80
80 -
 81
81 -
 82
82 -
 83
83 -
 84
84 -
 85
85 -
 86
86 -
 87
87 -
 88
88 -
89
-
90
-
91
-
92
-
93
-
94
-
95
-
96
-
97
-
98
-
99
-
100
-
101
-
102
-
103
-
104
 |
 |

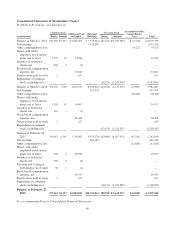
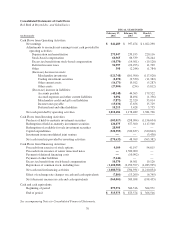
BED BATH & BEYOND INC. AND SUBSIDIARIES
Consolidated Balance Sheets
(in thousands, except per share data)
February 27,
2016
February 28,
2015
Assets
Current assets:
Cash and cash equivalents $ 515,573 $ 875,574
Short term investment securities 86,197 109,992
Merchandise inventories 2,848,119 2,731,881
Other current assets 376,073 366,156
Total current assets 3,825,962 4,083,603
Long term investment securities 71,289 97,160
Property and equipment, net 1,725,043 1,676,700
Goodwill 487,169 486,279
Other assets 389,477 415,251
Total assets $ 6,498,940 $ 6,758,993
Liabilities and Shareholders’ Equity
Current liabilities:
Accounts payable $ 1,100,958 $ 1,156,368
Accrued expenses and other current liabilities 409,445 403,547
Merchandise credit and gift card liabilities 297,930 306,160
Current income taxes payable 58,892 76,606
Total current liabilities 1,867,225 1,942,681
Deferred rent and other liabilities 499,368 493,137
Income taxes payable 72,807 79,985
Long term debt 1,500,000 1,500,000
Total liabilities 3,939,400 4,015,803
Commitments and contingencies
Shareholders’ equity:
Preferred stock – $0.01 par value; authorized – 1,000 shares; no shares issued
or outstanding ——
Common stock – $0.01 par value; authorized - 900,000 shares; issued 337,613
and 336,667 shares, respectively; outstanding 156,690 and 174,178 shares,
respectively 3,377 3,367
Additional paid-in capital 1,884,813 1,796,692
Retained earnings 10,394,865 9,553,376
Treasury stock, at cost (9,668,517) (8,567,932)
Accumulated other comprehensive loss (54,998) (42,313)
Total shareholders’ equity 2,559,540 2,743,190
Total liabilities and shareholders’ equity $ 6,498,940 $ 6,758,993
See accompanying Notes to Consolidated Financial Statements.
66