BMW 2008 Annual Report Download - page 76
Download and view the complete annual report
Please find page 76 of the 2008 BMW annual report below. You can navigate through the pages in the report by either clicking on the pages listed below, or by using the keyword search tool below to find specific information within the annual report.-
 1
1 -
2
-
3
-
4
-
5
-
6
-
7
-
8
-
9
-
10
-
11
-
12
-
13
-
14
-
15
-
16
-
17
-
18
-
19
-
20
-
21
-
22
-
23
-
24
-
25
-
26
-
27
-
28
-
29
-
30
-
31
-
32
-
33
-
34
-
35
-
36
-
37
-
38
-
39
-
40
-
41
-
42
-
43
-
44
-
45
-
46
-
47
-
48
-
49
-
50
-
51
-
52
-
53
-
54
-
55
-
56
-
57
-
58
-
59
-
60
-
61
-
62
-
63
-
64
-
65
-
 66
66 -
 67
67 -
 68
68 -
 69
69 -
 70
70 -
 71
71 -
 72
72 -
 73
73 -
 74
74 -
 75
75 -
 76
76 -
 77
77 -
 78
78 -
 79
79 -
 80
80 -
 81
81 -
 82
82 -
 83
83 -
 84
84 -
 85
85 -
 86
86 -
87
-
88
-
89
-
90
-
91
-
92
-
93
-
94
-
95
-
96
-
97
-
98
-
99
-
100
-
101
-
102
-
103
-
104
-
105
-
106
-
107
-
108
-
109
-
110
-
111
-
112
-
113
-
114
-
115
-
116
-
117
-
118
-
119
-
120
-
121
-
122
-
123
-
124
-
125
-
126
-
127
-
128
-
129
-
130
-
131
-
132
-
133
-
134
-
135
-
136
-
137
-
138
-
139
-
140
-
141
-
142
-
143
-
144
-
145
-
146
-
147
-
148
-
149
-
150
-
151
-
152
-
153
-
154
-
155
-
156
-
157
-
158
-
159
-
160
-
161
-
162
-
163
-
164
-
165
-
166
-
167
-
168
-
169
-
170
-
171
-
172
-
173
-
174
-
175
-
176
-
177
-
178
-
179
-
180
-
181
-
182
-
183
-
184
-
185
-
186
-
187
-
188
-
189
-
190
-
191
-
192
-
193
-
194
-
195
-
196
-
197
-
198
-
199
-
200
-
201
-
202
-
203
-
204
-
205
-
206
-
207
-
208
-
209
-
210
-
211
-
212
-
213
-
214
-
215
-
216
-
217
-
218
-
219
-
220
-
221
-
222
-
223
-
224
-
225
-
226
-
227
-
228
-
229
-
230
-
231
-
232
-
233
-
234
-
235
-
236
-
237
-
238
-
239
-
240
-
241
-
242
-
243
-
244
-
245
-
246
-
247
-
248
-
249
 |
 |

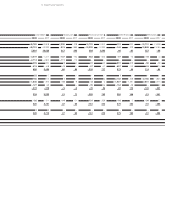
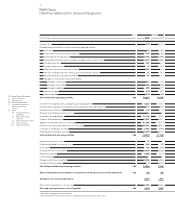
77 Group Financial Statements
Automobiles Financial Services
2008 2007
1 2008 2007
1
226 2,721 –161 474 Net profit / loss
Reconciliation of net profit / loss to cash inflow from operating activities
379 1,043 – 294 1 Current tax
–113 –155 5 –
2 Other interest and similar income / expenses
6 4 6,591 4,324 Depreciation of leased products
3,567 3,568 26 24 Depreciation and amortisation of tangible, intangible and investment assets
– 515 236 62 –109 Change in provisions
– 213 – 459 192 358 Change in deferred taxes
94 98 163 – 78 Other non-cash income and expense items
– 22 –180 1 1 Gain / loss on disposal of non-current assets and marketable securities
– 25 –11 – – Result from equity accounted investments
Changes in current assets and current liabilities
9 – 663 1 3 Change in inventories
597 371 –1,177 – 528 Change in receivables
571 85 268 738 Change in liabilities
– 281 – 589 – 74 – 98 Income taxes paid
191 177 – –
2 Interest received
4,471 6,246 5,603 5,110 Cash inflow from operating activities
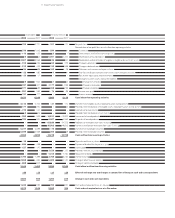
– 4,114 – 4,103 – 31 –110 Investment in intangible assets and property, plant and equipment
177 270 – 2 Proceeds from the disposal of intangible assets and property, plant and equipment
– 319 –147 – – Expenditure for investments
2 16 – – Proceeds from the disposal of investments
– 353 – 359 – 14,811 –12,902 Investment in leased products
333 354 5,507 4,563 Disposals of leased products
– – – 61,630 – 54,573 Additions to receivables from sales financing
– – 56,562 49,813 Payments received on receivables from sales financing
– 5,317 – 2,698 – 75 – Investment in marketable securities
5,039 2,568 260 9 Proceeds from marketable securities
– 4,552 – 4,099 –14,218 –13,198 Cash outflow from investing activities
–10 – – – Repurchase of treasury shares
– 694 – 458 – – Payment of dividend for the previous year
–127 – 147 – – 2 Interest paid
– – 1,129 1,127 Proceeds from the issue of bonds
– – –1,412 –1,160 Repayment of bonds
2,786 –1,389 3,768 6,233 Internal financing
2,858 – 333 6,405 2,140 Change in other financial liabilities
– 868 845 – – Change in commercial paper
3,945 –1,482 9,890 8,340 Cash inflow / outflow from financing activities
– 40 – 15 –11 – 20 Effect of exchange rate and changes in composition of Group on cash and cash equivalents
3,824 650 1,264 232 Change in cash and cash equivalents
1,249 599 789 557 Cash and cash equivalents as at January
5,073 1,249 2,053 789 Cash and cash equivalents as at December