BMW 2008 Annual Report Download - page 16
Download and view the complete annual report
Please find page 16 of the 2008 BMW annual report below. You can navigate through the pages in the report by either clicking on the pages listed below, or by using the keyword search tool below to find specific information within the annual report.-
 1
1 -
2
-
3
-
4
-
5
-
 6
6 -
 7
7 -
 8
8 -
 9
9 -
 10
10 -
 11
11 -
 12
12 -
 13
13 -
 14
14 -
 15
15 -
 16
16 -
 17
17 -
 18
18 -
 19
19 -
 20
20 -
 21
21 -
 22
22 -
 23
23 -
 24
24 -
 25
25 -
 26
26 -
27
-
28
-
29
-
30
-
31
-
32
-
33
-
34
-
35
-
36
-
37
-
38
-
39
-
40
-
41
-
42
-
43
-
44
-
45
-
46
-
47
-
48
-
49
-
50
-
51
-
52
-
53
-
54
-
55
-
56
-
57
-
58
-
59
-
60
-
61
-
62
-
63
-
64
-
65
-
66
-
67
-
68
-
69
-
70
-
71
-
72
-
73
-
74
-
75
-
76
-
77
-
78
-
79
-
80
-
81
-
82
-
83
-
84
-
85
-
86
-
87
-
88
-
89
-
90
-
91
-
92
-
93
-
94
-
95
-
96
-
97
-
98
-
99
-
100
-
101
-
102
-
103
-
104
-
105
-
106
-
107
-
108
-
109
-
110
-
111
-
112
-
113
-
114
-
115
-
116
-
117
-
118
-
119
-
120
-
121
-
122
-
123
-
124
-
125
-
126
-
127
-
128
-
129
-
130
-
131
-
132
-
133
-
134
-
135
-
136
-
137
-
138
-
139
-
140
-
141
-
142
-
143
-
144
-
145
-
146
-
147
-
148
-
149
-
150
-
151
-
152
-
153
-
154
-
155
-
156
-
157
-
158
-
159
-
160
-
161
-
162
-
163
-
164
-
165
-
166
-
167
-
168
-
169
-
170
-
171
-
172
-
173
-
174
-
175
-
176
-
177
-
178
-
179
-
180
-
181
-
182
-
183
-
184
-
185
-
186
-
187
-
188
-
189
-
190
-
191
-
192
-
193
-
194
-
195
-
196
-
197
-
198
-
199
-
200
-
201
-
202
-
203
-
204
-
205
-
206
-
207
-
208
-
209
-
210
-
211
-
212
-
213
-
214
-
215
-
216
-
217
-
218
-
219
-
220
-
221
-
222
-
223
-
224
-
225
-
226
-
227
-
228
-
229
-
230
-
231
-
232
-
233
-
234
-
235
-
236
-
237
-
238
-
239
-
240
-
241
-
242
-
243
-
244
-
245
-
246
-
247
-
248
-
249
 |
 |

17 Group Management Report
shrank considerably. The rate of growth in India also re-
mained lower than the rates registered in preceding years.
Declining export volumes in particular caused the current
account deficit to widen.
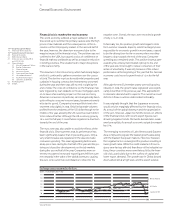
US dollar appreciates against the euro
The value of the US dollar against the euro increased sig-
nificantly during the second half of . Having fallen to
an all-time low of almost US dollar . to the euro in April,
it went on to reach its highest level in two years at US dol-
lar
. to the euro in November. By the end of the period
under report, it had stabilised at a level of approximately
US dollar . to the euro. The US dollar’s closing rate was
therefore . up on one year earlier.
Similarly, there was a sharp rise in the value of the Japanese
yen compared to the euro. After reaching its lowest level
for the year of almost yen to the euro, by the end of
the year its value was fluctuating between yen and yen
to the euro. The Japanese currency rose in value by
around during the year, strengthening from yen to
the euro at the beginning of the year to yen to the euro
at the end of the year.
By contrast the British pound saw a massive drop in value
in , with an exchange rate of GBP . to the euro. This
means that it lost approximately in value over the
course of .
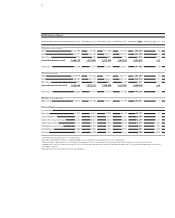
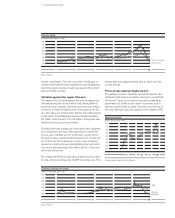
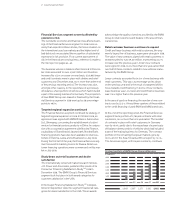
Prices of raw materials highly volatile
The global economic downturn caused demand for raw
materials to fall sharply worldwide during the second half
of the year. The price of crude oil reached its peak at ap-
proximately US dollar per barrel in summer . It
then proceeded to fall to under US dollar by the end of
the year. Although reducing supplies to the market, OPEC
Oil price trend
Price per barrel of Brent Crude
160
140
120
100
80
60
40
20
04 05 06 07 08
Source: Reuters
Price in Euro
Price in US Dollar
Precious metals price trend
(Index: December = )
400
350
300
250
200
150
100
04 05 06 07 08
Source: Reuters
Gold
Palladium
Platinum
Steel price trend
(Index: January = )
180
170
160
150
140
130
120
110
100
04 05 06 07 08
Source: German Federal Statistical Agency