BMW 2008 Annual Report Download - page 31
Download and view the complete annual report
Please find page 31 of the 2008 BMW annual report below. You can navigate through the pages in the report by either clicking on the pages listed below, or by using the keyword search tool below to find specific information within the annual report.-
 1
1 -
2
-
3
-
4
-
5
-
6
-
7
-
8
-
9
-
10
-
11
-
12
-
13
-
14
-
15
-
16
-
17
-
18
-
19
-
20
-
 21
21 -
 22
22 -
 23
23 -
 24
24 -
 25
25 -
 26
26 -
 27
27 -
 28
28 -
 29
29 -
 30
30 -
 31
31 -
 32
32 -
 33
33 -
 34
34 -
 35
35 -
 36
36 -
 37
37 -
 38
38 -
 39
39 -
 40
40 -
 41
41 -
42
-
43
-
44
-
45
-
46
-
47
-
48
-
49
-
50
-
51
-
52
-
53
-
54
-
55
-
56
-
57
-
58
-
59
-
60
-
61
-
62
-
63
-
64
-
65
-
66
-
67
-
68
-
69
-
70
-
71
-
72
-
73
-
74
-
75
-
76
-
77
-
78
-
79
-
80
-
81
-
82
-
83
-
84
-
85
-
86
-
87
-
88
-
89
-
90
-
91
-
92
-
93
-
94
-
95
-
96
-
97
-
98
-
99
-
100
-
101
-
102
-
103
-
104
-
105
-
106
-
107
-
108
-
109
-
110
-
111
-
112
-
113
-
114
-
115
-
116
-
117
-
118
-
119
-
120
-
121
-
122
-
123
-
124
-
125
-
126
-
127
-
128
-
129
-
130
-
131
-
132
-
133
-
134
-
135
-
136
-
137
-
138
-
139
-
140
-
141
-
142
-
143
-
144
-
145
-
146
-
147
-
148
-
149
-
150
-
151
-
152
-
153
-
154
-
155
-
156
-
157
-
158
-
159
-
160
-
161
-
162
-
163
-
164
-
165
-
166
-
167
-
168
-
169
-
170
-
171
-
172
-
173
-
174
-
175
-
176
-
177
-
178
-
179
-
180
-
181
-
182
-
183
-
184
-
185
-
186
-
187
-
188
-
189
-
190
-
191
-
192
-
193
-
194
-
195
-
196
-
197
-
198
-
199
-
200
-
201
-
202
-
203
-
204
-
205
-
206
-
207
-
208
-
209
-
210
-
211
-
212
-
213
-
214
-
215
-
216
-
217
-
218
-
219
-
220
-
221
-
222
-
223
-
224
-
225
-
226
-
227
-
228
-
229
-
230
-
231
-
232
-
233
-
234
-
235
-
236
-
237
-
238
-
239
-
240
-
241
-
242
-
243
-
244
-
245
-
246
-
247
-
248
-
249
 |
 |

32
14 Group Management Report
14 A Review of the Financial Year
16 General Economic Environment
20 Review of Operations
42 BMW Stock and Bonds
45 Disclosures pursuant to § 289 (4)
and § 315 (4) HGB
47 Financial Analysis
47 Internal Management System
49 Earnings Performance
51 Financial Position
52 Net Assets Position
55 Subsequent Events Report
55 Value Added Statement
57 Key Performance Figures
58 Comments on BMW AG
62 Risk Management
68 Outlook
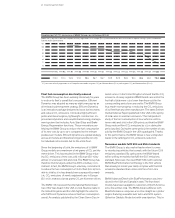
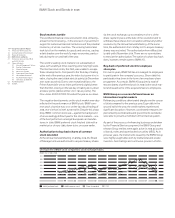
Energy consumed per vehicle produced
in MWh / vehicle
3.10
3.00
2.90
2.80
2.70
2.60
04 05 06 07
* 08
2.94 2.94 2.90 2.78 2.80
*
Basis for data expanded in from ten to locations. Until : Munich,
Dingolfing, Landshut, Regensburg, Leipzig, Steyr, Rosslyn, Spartanburg, Hams Hall,
Oxford. Since :
Berlin (brake disc production), Eisenach, Swindon, Goodwood,
Rayong (assembly), Chennai
(assembly) and BMW Brilliance in Shenyang.
CO emissions per vehicle produced
in t / vehicle
1.05
1.00
0.95
0.90
0.85
0.80
04 05
1 06 07
2
08
0.94 0.99 0.94 0.84 0.82
The increase is attributable to a change in the energy mix.
B
asis for data expanded in from ten to locations. Until : Munich,
Dingolfing, Landshut, Regensburg, Leipzig, Steyr, Rosslyn, Spartanburg, Hams Hall,
Oxford. Since :
Berlin (brake disc production), Eisenach, Swindon, Goodwood,
Rayong (assembly), Chennai
(assembly) and BMW Brilliance in Shenyang.
Further enhancements in environmentally
compatible vehicle design
The BMW Group again set new milestones in improving
the environmental compatibility of its products in .
One example of this is the creation of a comprehensive
product data system containing details of the material
composition of all components used in a vehicle. In May
, with the help of this system, the BMW Group became
the first carmaker to present a virtual “material balance
sheet” (for the new BMW 7 Series) conforming to interna-
tional standard ISO .
Furthermore, in a large-scale industrial trial, the BMW
Group was able to demonstrate that, with the aid of post-
shredder technology, BMW Group-manufactured cars
are at least recyclable and up to recoverable. Un-
der the post-shredder method (after vehicles have been
dismantled and shredded mechanically), shredder residue
fractions are sorted and sifted into their various constituent
materials such as metals, plastics and minerals, in prepara-
tion for further processing.
Thanks to the extensive preparatory work carried out, the
BMW Group passed the preliminary tests of the relevant
licensing agency in May . The BMW Group therefore
complies with the regulations of the European Directive
/ / EG on type approval of motor vehicles with regard
to their reusability, recyclability and recoverability. The use
of recovered materials (recyclates) was also increased in
. The proportion of recyclates used in the new BMW
7 Series for instance was increased by approximately
compared to the preceding model. The use of quality-ap-
proved recyclates reduces costs and preserves resources
while still ensuring compliance with established quality
standards.
Strict management of environmental care activities
The BMW Group applies the “Clean Production” phi-
losophy to its production activities. In line with this forward-
looking commitment to environmental care, the BMW
Group endeavours to achieve systematic and consistent
reductions in the volume of resources used and to lessen
the impact of production activities on the environment.
In order to monitor this, environmentally relevant indicators
are measured automatically and reported on a monthly
basis.
The following key indicators – expressed as amounts per
vehicle produced – are integral components of the group-
wide target system and are managed accordingly:
– energy consumption
– water consumption
– process wastewater
– solvent emissions
– waste for disposal
CO emissions per vehicle produced are also recorded
based on the amount of energy consumed and the energy
mix used.
The target for the global production network is to reduce
these key indicators by between and . This
entails achieving an average reduction of p. a. These
targets can, however, vary as a result of model production
start-ups, discontinuations or changed production vol-
umes. The reduction across all key indicators is additionally
examined on the basis of an Environmental Efficiency
Ratio (EER). The EER computation for showed that
the improvement in resource efficiency remained within
the agreed target corridor.