Avon 2005 Annual Report Download - page 7
Download and view the complete annual report
Please find page 7 of the 2005 Avon annual report below. You can navigate through the pages in the report by either clicking on the pages listed below, or by using the keyword search tool below to find specific information within the annual report.-
 1
1 -
 2
2 -
 3
3 -
 4
4 -
 5
5 -
 6
6 -
 7
7 -
 8
8 -
 9
9 -
 10
10 -
 11
11 -
 12
12 -
 13
13 -
 14
14 -
 15
15 -
 16
16 -
 17
17 -
 18
18 -
19
-
20
-
21
-
22
-
23
-
24
-
25
-
26
-
27
-
28
-
29
-
30
-
31
-
32
-
33
-
34
-
35
-
36
-
37
-
38
-
39
-
40
-
41
-
42
-
43
-
44
-
45
-
46
-
47
-
48
-
49
-
50
-
51
-
52
-
53
-
54
-
55
-
56
-
57
 |
 |

2005ANNUALREPORT27
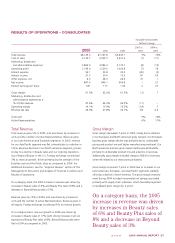
Total Revenue
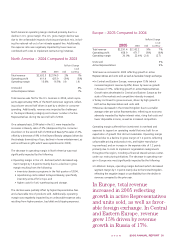
Total revenue grew 5% in 2005, and was driven by increases in
units and the number of active Representatives. Revenue grew
in our Latin American and European segments. In 2005, revenue
for our Asia Pacific segment was flat, primarily due to a decline in
China. Revenue declined in our North American segment, primar-
ily due to a decline in Beauty sales and our ongoing reposition-
ing of Beyond Beauty in the U.S. Foreign exchange contributed
3% to revenue growth, driven primarily by the strength of the
Brazilian real and the Polish zloty as compared to 2004. For
additional discussion, see the “Segment Review” section of this
Management’s Discussion and Analysis of Financial Condition and
Results of Operations.
On a category basis, the 2005 increase in revenue was driven by
increases in Beauty sales of 6% and Beauty Plus sales of 8% and a
decrease in Beyond Beauty sales of 3%.
Revenue grew by 13% in 2004, and was driven by increases in
units and the number of active Representatives. Revenue grew in
all regions. Foreign exchange contributed 3% to revenue growth.
On a category basis, revenue growth in 2004 was driven by
increases in Beauty sales of 17% (with strong increases in all cat-
egories) and Beauty Plus sales of 8%. Beyond Beauty sales were
flat in 2004 as compared to 2003.
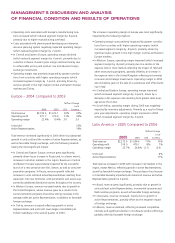
Gross Margin
Gross margin decreased .7 point in 2005, mainly due to declines
in our European and North American gross margins. Our European
business gross margin decline was primarily due to unfavorable
pricing and product mix and higher manufacturing overhead. Our
North American business gross margin decline was attributable
primarily to unfavorable product mix and a decline in revenues.
Additionally, gross margin included charges of $8.4 for inventory
write-offs related to our restructuring initiatives.
Gross margin improved .7 point in 2004 due to increases in our
Latin American, European, and Asia Pacific segments, partially
offset by a decline in North America. The gross margin improve-
ment during 2004 included incremental net savings associated
primarily with supply chain initiatives, which favorably impacted
consolidated gross margin by .2 point.
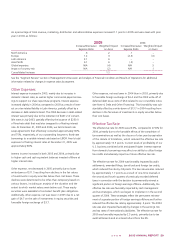
RESULTSOFOPERATIONS–CONSOLIDATED
Favorable (Unfavorable)
%/Point Change
2005 vs. 2004 vs.
2005 2004 2003 2004 2003
Total revenue $8,149.6 $7,747.8 $6,845.1 5% 13%
Cost of sales 3,133.7 2,932.5 2,631.6 (7) (11)
Marketing, distribution
and administrative expenses 3,866.9 3,586.3 3,170.7 (8) (13)
Operating profit 1,149.0 1,229.0 1,042.8 (7) 18
Interest expense 54.1 33.8 33.3 (60) (2)
Interest income 37.3 20.6 12.6 81 63
Other expense, net 8.0 28.3 28.6 72 1
Net income 847.6 846.1 664.8 – 27
Diluted earnings per share 1.81 1.77 1.39 2 27
Gross margin 61.5% 62.2% 61.5% (.7) .7
Marketing, distribution and
administrative expenses as a
% of total revenue 47.4% 46.3% 46.3% (1.1) –
Operating margin 14.1% 15.9% 15.2% (1.8) .7
Effective tax rate 24.0% 27.8% 32.1% 3.8 4.3
Units sold 3% 13%
Active Representatives 6% 11%
On a category basis, the 2005
increase in revenue was driven
by increases in Beauty sales
of 6% and Beauty Plus sales of
8% and a decrease in Beyond
Beauty sales of 3%.