Avon 2005 Annual Report Download - page 5
Download and view the complete annual report
Please find page 5 of the 2005 Avon annual report below. You can navigate through the pages in the report by either clicking on the pages listed below, or by using the keyword search tool below to find specific information within the annual report.-
 1
1 -
 2
2 -
 3
3 -
 4
4 -
 5
5 -
 6
6 -
 7
7 -
 8
8 -
 9
9 -
 10
10 -
 11
11 -
 12
12 -
 13
13 -
 14
14 -
 15
15 -
 16
16 -
17
-
18
-
19
-
20
-
21
-
22
-
23
-
24
-
25
-
26
-
27
-
28
-
29
-
30
-
31
-
32
-
33
-
34
-
35
-
36
-
37
-
38
-
39
-
40
-
41
-
42
-
43
-
44
-
45
-
46
-
47
-
48
-
49
-
50
-
51
-
52
-
53
-
54
-
55
-
56
-
57
 |
 |

2005ANNUALREPORT25
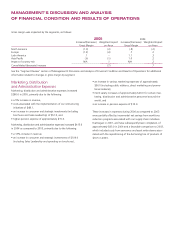
Allowances for Doubtful Accounts Receivable
Representatives contact their customers, selling primarily through
the use of brochures for each sales campaign. Sales campaigns
are generally for a two-week duration in the U.S. and a two- to
four-week duration outside the U.S. The Representative purchases
products directly from Avon and may or may not sell them to an
end user. In general, the Representative, an independent contractor,
remits a payment to Avon each sales campaign, which relates to
the prior campaign cycle. The Representative is generally precluded
from submitting an order for the current sales campaign until
the accounts receivable balance for the prior campaign is paid;
however, there are circumstances where the Representative fails to
make the required payment. We record an estimate of an allowance
for doubtful accounts on receivable balances based on an analysis
of historical data and current circumstances. Over the past three
years, annual bad debt expense has been approximately $125.0 to
$140.0, or approximately 1.8% of total revenue. We generally have
no detailed information concerning, or any communication with,
any end user of our products beyond the Representative. We have
no legal recourse against the end user for the collectibility of any
accounts receivable balances due from the Representative to us. If
the financial condition of our Representatives were to deteriorate,
resulting in an impairment of their ability to make payments, addi-
tional allowances may be required.
Allowances for Sales Returns
We record a provision for estimated sales returns based on histori-
cal experience with product returns. Over the past three years,
sales returns have been in the range of $285.0 to $290.0, or
approximately 3.8% of total revenue. If the historical data we use
to calculate these estimates does not approximate future returns,
due to changes in marketing or promotional strategies, or for
other reasons, additional allowances may be required.
Provisions for Inventory Obsolescence
We record an allowance for estimated obsolescence equal to the
difference between the cost of inventory and the estimated market
value. In determining the allowance for estimated obsolescence, we
classify inventory into various categories based upon its stage in the
product life cycle, future marketing sales plans and the disposition
process. We assign a degree of obsolescence risk to products based
on this classification to determine the level of obsolescence provi-
sion. If actual sales are less favorable than those projected by man-
agement, additional inventory allowances may need to be recorded
for such additional obsolescence. Over the past three years, annual
obsolescence expense has been in the range of $65.0 to $85.0.
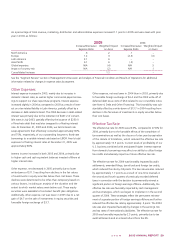
Pension, Postretirement and
Postemployment Benefit Expense
We maintain defined benefit pension plans, which cover substan-
tially all employees in the U.S. and in certain international locations.
Additionally, we have unfunded supplemental pension benefit plans
for certain current and retired executives (see Note 10, Employee
Benefit Plans).
Our calculations of pension, postretirement and postemployment
costs are dependent upon the use of assumptions, including
discount rates, expected return on plan assets, interest cost, health
care cost trend rates, benefits earned, mortality rates, the number
of associate retirements, the number of associates electing to take
lump-sum payments and other factors. Actual results that differ
from assumptions are accumulated and amortized over future
periods and, therefore, generally affect recognized expense and
the recorded obligation in future periods. At December 31, 2005,
we had unrecognized actuarial losses of $527.2 and $214.0 for the
U.S. and non-U.S. plans, respectively. While we believe that the
assumptions used are reasonable, differences in actual experience
or changes in assumptions may materially affect our pension, post-
retirement and postemployment obligations and future expense.
For the year ended December 31, 2005, the weighted average
assumed rate of return on all plan assets, including the U.S. and
non-U.S. plans was 7.7%. In determining the long-term rates
of return, we consider the nature of the plans’ investments, an
expectation for the plans’ investment strategies, historical rates of
return and current economic forecasts. We evaluate the expected
long-term rate of return annually and adjust as necessary.
The majority of our pension plan assets relate to the U.S. pension
plan. The assumed rate of return for 2005 for the U.S. plan was
8.0%, which was based on an asset allocation of approximately
35% in corporate and government bonds and mortgage-backed
securities (which are expected to earn approximately 5% to 7% in
the long term) and 65% in equity securities (which are expected
to earn approximately 8% to 10% in the long term). Historical
rates of return on the assets of the U.S. plan for the most recent
10-year and 20-year periods were 7.6% and 9.9%, respectively.
In the U.S. plan, our asset allocation policy has favored U.S. equity
securities, which have returned 8.6% and 11.9%, respectively,
over the 10-year and 20-year periods. The actual rate of return
on plan assets in the U.S. was approximately 5.5% and 12.2%
in 2005 and 2004, respectively.