Avon 2005 Annual Report Download - page 39
Download and view the complete annual report
Please find page 39 of the 2005 Avon annual report below. You can navigate through the pages in the report by either clicking on the pages listed below, or by using the keyword search tool below to find specific information within the annual report.-
 1
1 -
2
-
3
-
4
-
5
-
6
-
7
-
8
-
9
-
10
-
11
-
12
-
13
-
14
-
15
-
16
-
17
-
18
-
19
-
20
-
21
-
22
-
23
-
24
-
25
-
26
-
27
-
28
-
 29
29 -
 30
30 -
 31
31 -
 32
32 -
 33
33 -
 34
34 -
 35
35 -
 36
36 -
 37
37 -
 38
38 -
 39
39 -
 40
40 -
 41
41 -
 42
42 -
 43
43 -
 44
44 -
 45
45 -
 46
46 -
 47
47 -
 48
48 -
 49
49 -
50
-
51
-
52
-
53
-
54
-
55
-
56
-
57
 |
 |

2005ANNUALREPORT59
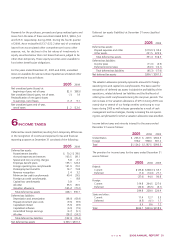
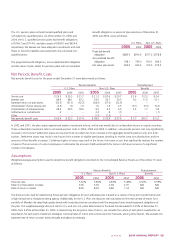
The U.S. pension plans include funded qualified plans and
unfunded non-qualified plans. As of December 31, 2005 and
2004, the U.S. qualified pension plans had benefit obligations
of $766.7 and $714.6, and plan assets of $693.0 and $624.4,
respectively. We believe we have adequate investments and cash
flows to fund the liabilities associated with the unfunded non-
qualified plans.
The projected benefit obligation, accumulated benefit obligation
and fair value of plan assets for pension plans with accumulated
benefit obligations in excess of plan assets as of December 31,
2005 and 2004, were as follows:
U.S. Plans Non-U.S. Plans
2005 2004 2005 2004
Projected benefit
obligation $883.9 $814.6 $577.2 $578.8
Accumulated benefit
obligation 798.1 736.0 550.1 544.2
Fair value plan assets 693.0 624.4 314.5 278.5
Net Periodic Benefit Costs
Net periodic benefit costs for the years ended December 31 were determined as follows:
Pension Benefits Postretirement
U.S. Plans Non-U.S. Plans Benefits
2005 2004 2003 2005 2004 2003 2005 2004 2003
Service cost $ 29.5 $ 25.5 $ 21.7 $ 21.2 $ 20.6 $ 20.7 $ 2.4 $ 2.5 $ 2.4
Interest cost 48.9 48.1 47.2 33.5 32.7 30.3 9.2 11.5 12.1
Expected return on plan assets (52.5) (51.5) (52.3) (28.5) (27.0) (22.9) – – –
Amortization of prior service cost (2.3) (.3) 1.9 1.6 1.4 3.5 (6.1) (5.0) (5.0)
Amortization of actuarial losses 38.6 30.5 18.9 9.5 6.3 6.0 2.2 1.7 1.8
Settlements or curtailments .2 – – 2.4 .8 (.1) – – (.1)
Other – – – (1.2) (1.2) .1 – – –
Net periodic benefit costs $ 62.4 $ 52.3 $ 37.4 $ 38.5 $ 33.6 $ 37.6 $ 7.7 $10.7 $11.2
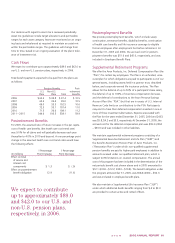
In 2002 and 2001, the plan assets experienced weaker investment returns, which was mostly due to unfavorable returns on equity securities.
These unfavorable investment returns increased pension costs in 2005, 2004 and 2003. In addition, net periodic pension cost may significantly
increase in the future if settlement losses are required to be recorded due to an increase in the aggregate benefits paid as lump sum distri-
butions. Settlement losses may result in the future if the number of eligible participants deciding to receive lump sum distributions and the
amount of their benefits increases. Curtailment gains or losses may result in the future if an event occurs that significantly reduces the number
of years of future service of current employees or eliminates the accrual of defined benefits for some or all future services of a significant
number of employees.
Assumptions
Weighted-average assumptions used to determine benefit obligations recorded on the Consolidated Balance Sheets as of December 31 were
as follows:
Pension Benefits Postretirement
U.S. Plans Non-U.S. Plans Benefits
2005 2004 2005 2004 2005 2004
Discount rate 5.50% 5.80% 4.83% 5.48% 5.50% 5.65%
Rate of compensation increase 6.00 6.00 2.94 2.91 N/A N/A
Rate of return on assets 8.00 8.00 6.86 7.14 N/A N/A
The discount rate used for determining future pension obligations for each individual plan is based on a review of long-term bonds that receive
a high rating from a recognized rating agency. Additionally, for the U.S. Plan, the discount rate was based on the internal rate of return for a
portfolio of Moody’s Aa-rated high quality bonds with maturities that are consistent with the projected future benefit payment obligations of
the plan. The weighted-average discount rate for U.S. and non-U.S. plans determined on this basis has decreased to 5.20% at December 31,
2005, from 5.65% at December 31, 2004. In determining the long-term rates of return, we consider the nature of each plan’s investments, an
expectation for each plan’s investment strategies, historical rates of return and current economic forecasts, among other factors. We evaluate the
expected rate of return on plan assets annually and adjust as necessary.