Avon 2005 Annual Report Download - page 22
Download and view the complete annual report
Please find page 22 of the 2005 Avon annual report below. You can navigate through the pages in the report by either clicking on the pages listed below, or by using the keyword search tool below to find specific information within the annual report.-
 1
1 -
2
-
3
-
4
-
5
-
6
-
7
-
8
-
9
-
10
-
11
-
 12
12 -
 13
13 -
 14
14 -
 15
15 -
 16
16 -
 17
17 -
 18
18 -
 19
19 -
 20
20 -
 21
21 -
 22
22 -
 23
23 -
 24
24 -
 25
25 -
 26
26 -
 27
27 -
 28
28 -
 29
29 -
 30
30 -
 31
31 -
 32
32 -
33
-
34
-
35
-
36
-
37
-
38
-
39
-
40
-
41
-
42
-
43
-
44
-
45
-
46
-
47
-
48
-
49
-
50
-
51
-
52
-
53
-
54
-
55
-
56
-
57
 |
 |

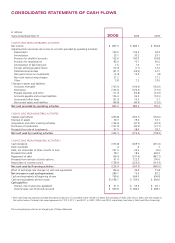
In millions
Years ended December 31 2005 2004 2003
CASH FLOWS FROM OPERATING ACTIVITIES
Net income $ 847.6 $ 846.1 $ 664.8
Adjustments to reconcile net income to net cash provided by operating activities:
Depreciation 106.5 103.5 94.4
Amortization 33.1 30.2 29.1
Provision for doubtful accounts 135.6 140.0 124.8
Provision for obsolescence 83.9 76.7 66.2
Amortization of debt discount 1.6 1.6 9.7
Foreign exchange (gains) losses (16.3) (1.1) 12.2
Deferred income taxes (31.7) (55.0) 22.7
Net (gains) losses on investments (2.4) 13.5 (.8)
Non-cash restructuring charges 21.2 – 12.1
Other 5.8 7.2 13.0
Changes in assets and liabilities:
Accounts receivable (163.5) (164.6) (142.6)
Inventories (152.6) (126.5) (77.0)
Prepaid expenses and other (11.0) (55.8) (23.9)
Accounts payable and accrued liabilities 126.4 96.9 (52.5)
Income and other taxes (21.9) 10.3 5.1
Noncurrent assets and liabilities (66.8) (40.4) (12.0)
Net cash provided by operating activities 895.5 882.6 745.3
CASH FLOWS FROM INVESTING ACTIVITIES
Capital expenditures (206.8) (250.1) (162.6)
Disposal of assets 30.3 19.6 14.1
Acquisitions and other investing activities (156.6) (47.5) (20.4)
Purchases of investments (107.9) (30.0) (37.7)
Proceeds from sale of investments 97.9 28.6 28.2
Net cash used by investing activities (343.1) (279.4) (178.4)
CASH FLOWS FROM FINANCING ACTIVITIES*
Cash dividends (313.8) (269.7) (201.4)
Book overdrafts .4 .4 .7
Debt, net (maturities of three months or less) 731.5 23.2 (2.6)
Proceeds from debt 78.7 18.4 303.2
Repayment of debt (56.9) (237.4) (481.7)
Proceeds from exercise of stock options 61.4 122.3 100.6
Repurchase of common stock (728.0) (224.2) (214.3)
Net cash used by financing activities (226.7) (567.0) (495.5)
Effect of exchange rate changes on cash and equivalents (36.6) 39.4 15.8
Net increase in cash and equivalents 289.1 75.6 87.2
Cash and equivalents at beginning of year 769.6 694.0 606.8
Cash and equivalents at end of year $1,058.7 $ 769.6 $ 694.0
Cash paid for:
Interest, net of amounts capitalized $ 51.0 $ 35.4 $ 25.1
Income taxes, net of refunds received $ 309.8 $ 384.0 $ 298.7
* Non-cash financing activities included the partial conversion of convertible notes of $48.3 in 2003, the exchange of debt of $125.0 in 2003, and the change in
fair market value of interest rate swap agreements of $15.3, $15.1, and $53.1 in 2005, 2004, and 2003, respectively (see Note 4, Debt and Other Financing).
The accompanying notes are an integral part of these statements.
CONSOLIDATEDSTATEMENTSOFCASHFLOWS