Avon 2005 Annual Report Download - page 14
Download and view the complete annual report
Please find page 14 of the 2005 Avon annual report below. You can navigate through the pages in the report by either clicking on the pages listed below, or by using the keyword search tool below to find specific information within the annual report.
MANAGEMENT’SDISCUSSIONANDANALYSIS
OFFINANCIALCONDITIONANDRESULTSOFOPERATIONS
The increase in operating margin in Latin America was most signifi-
cantly impacted by the following markets:
• In Venezuela, operating margin increased (which increased seg-
ment margin by .8 point) reflecting a lower expense ratio result-
ing from sales growth and general cost containment initiatives.
Operating margin was also favorably impacted by an improve-
ment in gross margin resulting from higher prices, as well as
supply chain savings mainly due to a lower cost of materials.
• In Brazil, operating margin increased (which increased segment
margin by .6 point) resulting from an improvement in gross
margin, reflecting savings associated with supply chain initiatives
and the impact of a sales tax reform in 2004, which allows Avon
Brazil to receive tax credits on inventory purchases.
• In Mexico, operating margin decreased (which decreased seg-
ment margin by .5 point) primarily due to a lower gross margin
reflecting an unfavorable mix of products sold. Additionally,
operating margin was unfavorably impacted by a higher
expense ratio resulting from unfavorable comparisons to 2003
(the second quarter of 2003 included a gain from the sale of
a warehouse property in Mexico City as we transitioned to a
new distribution facility in Celaya).
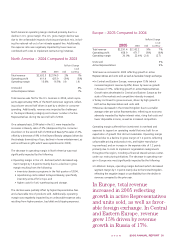
Asia Pacific – 2005 Compared to 2004
%/Point Change
Local
2005 2004 US$ Currency
Total revenue $1,075.1 $1,078.7 – % (1)%
Operating profit 141.5 192.7 (27)% (28)%
Operating margin 13.2% 17.9% (4.7) (4.8)
Units sold (1)%
Active Representatives 2%
Total revenue was consistent with the prior year as declines in
revenue in China and Japan were offset by increases in nearly all
other markets in Asia Pacific.
• Revenue in China declined 7%. Beginning in the second quarter
of 2005, our China Beauty Boutique owners reduced the size of
their orders as compared to the prior year in connection with the
anticipated resumption of direct selling. In April 2005, the Chinese
government granted approval to Avon to proceed with a limited
test of direct selling in certain areas. The Chinese government
later issued direct selling regulations in late 2005 to become
effective with the opening of the licensing application process in
December 2005.
In late February 2006, Avon was granted a direct selling license
by China’s Ministry of Commerce. That license will allow Avon to
commence direct selling in China under the regulations issued by
that government in late 2005.
• Revenue declined in Japan primarily due to a decrease in active
Representatives.
Asia Pacific operating margin declined, primarily due to costs to
implement restructuring initiatives, mainly the closure of our opera-
tions in Indonesia, (which decreased segment margin by 2.0 points)
and declines in operating margin in China and Japan.
• In China, operating margin decreased (which decreased segment
margin by 1.8 points) driven by incremental costs to prepare for
direct selling and the cost of maintaining our consumer invest-
ment, primarily through advertising, against a significantly lower
revenue base.
• In Japan, operating margin decreased (which decreased segment
margin by .6 points), primarily due to a decline in revenue.
The deceleration of active Representative growth was primarily
driven by Japan, partially offset by growth in active Representatives
in the Philippines partially due to an increase in the number of
sales campaigns in the Philippines beginning in the second quarter
of 2004, which increased the active Representative growth in the
region by 2 points.
Asia Pacific – 2004 Compared to 2003
%/Point Change
Local
2004 2003 US$ Currency
Total revenue $1,078.7 $ 939.6 15% 11%
Operating profit 192.7 156.6 23% 19%
Operating margin 17.9% 16.7% 1.2 1.2
Units sold 21%
Active Representatives 13%
Total revenue increased as a result of growth in nearly all mar-
kets in the region, reflecting increases in units sold and active
Representatives, as well as the favorable impact of foreign
exchange. The growth in active Representatives was partially
due to an increase in the number of sales campaigns in the
Philippines beginning in the second quarter of 2004, which
resulted in additional opportunities to order and increased the
active Representative growth rate in the region by 5 points.
In Asia Pacific, total revenue
was consistent with the prior
year as declines in China and
Japan were offset by increases
in nearly all other markets in
the region.


