Avon 2005 Annual Report Download - page 15
Download and view the complete annual report
Please find page 15 of the 2005 Avon annual report below. You can navigate through the pages in the report by either clicking on the pages listed below, or by using the keyword search tool below to find specific information within the annual report.-
 1
1 -
2
-
3
-
4
-
 5
5 -
 6
6 -
 7
7 -
 8
8 -
 9
9 -
 10
10 -
 11
11 -
 12
12 -
 13
13 -
 14
14 -
 15
15 -
 16
16 -
 17
17 -
 18
18 -
 19
19 -
 20
20 -
 21
21 -
 22
22 -
 23
23 -
 24
24 -
 25
25 -
26
-
27
-
28
-
29
-
30
-
31
-
32
-
33
-
34
-
35
-
36
-
37
-
38
-
39
-
40
-
41
-
42
-
43
-
44
-
45
-
46
-
47
-
48
-
49
-
50
-
51
-
52
-
53
-
54
-
55
-
56
-
57
 |
 |

2005ANNUALREPORT35
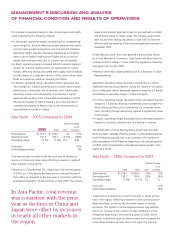
• In China, revenue increased primarily due to growth in units
sold driven by advertising and consumer promotion programs,
as well as growth in the number of and increased activity at
the Beauty Boutiques.
• In Australia and Taiwan, revenue increased primarily due to growth
in active Representatives as well as favorable foreign exchange.
• In Malaysia, revenue increased mainly due to benefits associated
with the 2003 reorganization of sales branches in that country.
The increase in operating margin in Asia Pacific was most signifi-
cantly impacted by the following markets:
• In China, operating margin improved (which increased seg-
ment margin by .6 point) reflecting a higher gross margin
benefiting from savings associated with supply chain Business
Transformation initiatives.
• In Malaysia, operating margin improved (which increased seg-
ment margin by .5 point) primarily due to benefits associated
with the 2003 reorganization of sales branches in that country
and the resulting leverage achieved from this reorganization.
• In Australia, operating margin improved (which increased seg-
ment margin by .5 point) primarily due to a higher gross margin,
reflecting favorable foreign exchange on inventory purchases.
• In Japan, operating margin improved (which increased segment
margin by .4 point), resulting primarily from an increase in gross
margin driven by savings associated with supply chain Business
Transformation initiatives, partially offset by higher expenses
associated with customer acquisition programs.
In addition, expenses in the region included strategic investments
in organization capacity (which decreased segment margin by
1.0 point).
We have operations in four of the countries (India, Indonesia,
Malaysia and Thailand) that were affected by the December 2004
tsunami and earthquake in Southeast Asia. The earthquake and
tsunami did not have a material impact on property or 2004 or
2005 operating profit.
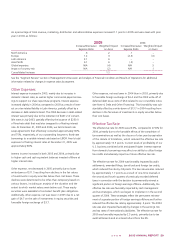
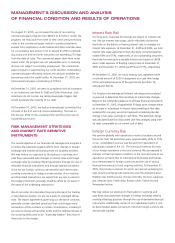
Global Expenses
Global expenses decreased $5.0 in 2005, primarily due to lower
expense for performance-based compensation plans, partially
offset by costs for organization downsizing, under our restructur-
ing initiatives.
Global expenses increased $66.5 in 2004 primarily due to higher
bonus and benefit-related accruals of approximately $25.0, higher
professional fees and expenses of $22.4 (including $6.2 related to
the settlement of one Solow lawsuit, see Note 14, Contingencies)
and incremental investments of $15.4 for research and develop-
ment, and marketing.
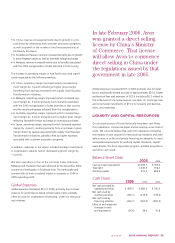
LIQUIDITYANDCAPITALRESOURCES
Our principal sources of funds historically have been cash flows
from operations, commercial paper and borrowings under lines of
credit. We currently believe that cash from operations (including
the impacts of cash required for restructuring initiatives) and avail-
able sources of public and private financing are adequate to meet
anticipated requirements for working capital, dividends, capital
expenditures, the stock repurchase program, possible acquisitions
and other cash needs.
Balance Sheet Data
2005 2004
Cash and cash equivalents $1,058.7 $ 769.6
Total debt 1,649.0 918.0
Working capital 419.3 896.9
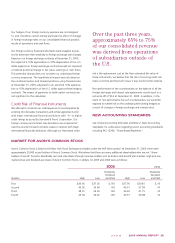
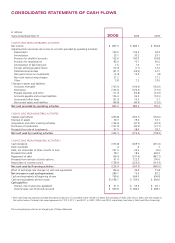
Cash Flows
2005 2004 2003
Net cash provided by
operating activities $ 895.5 $ 882.6 $ 745.3
Net cash used by
investing activities (343.1) (279.4) (178.4)
Net cash used by
financing activities (226.7) (567.0) (495.5)
Effect of exchange rate
changes on cash
and equivalents (36.6) 39.4 15.8
In late February 2006, Avon
was granted a direct selling
license by China’s Ministry
of Commerce. That license
will allow Avon to commence
direct selling in China under
the regulations issued by that
government in late 2005.