Avon 2005 Annual Report Download - page 42
Download and view the complete annual report
Please find page 42 of the 2005 Avon annual report below. You can navigate through the pages in the report by either clicking on the pages listed below, or by using the keyword search tool below to find specific information within the annual report.-
 1
1 -
2
-
3
-
4
-
5
-
6
-
7
-
8
-
9
-
10
-
11
-
12
-
13
-
14
-
15
-
16
-
17
-
18
-
19
-
20
-
21
-
22
-
23
-
24
-
25
-
26
-
27
-
28
-
29
-
30
-
31
-
 32
32 -
 33
33 -
 34
34 -
 35
35 -
 36
36 -
 37
37 -
 38
38 -
 39
39 -
 40
40 -
 41
41 -
 42
42 -
 43
43 -
 44
44 -
 45
45 -
 46
46 -
 47
47 -
 48
48 -
 49
49 -
 50
50 -
 51
51 -
 52
52 -
53
-
54
-
55
-
56
-
57
 |
 |

NOTESTOCONSOLIDATEDFINANCIALSTATEMENTS
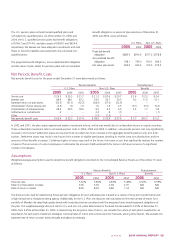
We established a grantor trust to provide assets that may be used
for the benefits payable under the SERP, Restoration Plan and SLIP
and for obligations under the Plan. The trust is irrevocable and,
although subject to creditors’ claims, assets contributed to the
trust can only be used to pay such benefits with certain excep-
tions. The assets held in the trust at December 31, 2005, amount-
ing to $83.4 (2004 – $81.8), consisted of a fixed-income portfolio,
corporate-owned life insurance policies and cash and cash equiva-
lents. These assets are included in other assets. The cash surrender
value of the corporate-owned life insurance policies included
in the grantor trust at December 31, 2005, was $34.1 (2004
– $32.1). Refer to Note 5, Accumulated Other Comprehensive
Loss, for a summary of assets maintained in the grantor trust.
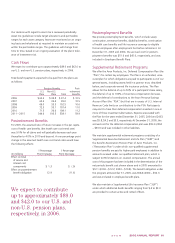
Additionally, we held assets at December 31, 2005 and 2004,
amounting to $45.7 and $34.2, respectively, that may be used
for other benefit payments. At December 31, 2005 and 2004,
the assets consisted of corporate-owned life insurance policies
with cash surrender values of $43.5 and $31.9, respectively,
and mutual funds with market values of $2.2 and $2.3, respec-
tively. The assets are recorded at market value, with increases or
decreases in the corporate-owned life insurance policies reflected
in the Consolidated Statements of Income.
11
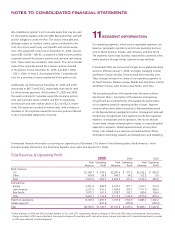
SEGMENTINFORMATION
Our operating segments, which are our reportable segments, are
based on geographic operations and include operating business
units in North America, Europe, Latin America, and Asia Pacific.
The segments have similar business characteristics and each offers
similar products through similar customer access methods.
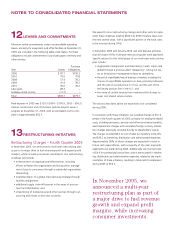
In December 2005, we announced changes to our global operating
structure. Effective January 1, 2006, we began managing Central
and Eastern Europe and also China as stand-alone business units.
These changes increase the number of our operating segments to
six: North America; Western Europe, Middle East and Africa; Central
and Eastern Europe; Latin America; Asia Pacific; and China.
The accounting policies of the segments are the same as those
described in Note 1, Description of the Business and Summary
of Significant Accounting Policies. We evaluate the performance
of our segments based on operating profits or losses. Segment
revenues reflect direct sales of products to Representatives based
on the Representative’s geographic location. Intersegment sales and
transfers are not significant. Each segment records direct expenses
related to its employees and its operations. We do not allocate
income taxes, foreign exchange gains or losses, or corporate global
expenses to segments. Global expenses include, among other
things, costs related to our executive and administrative offices,
information technology, research and development, and marketing.
Summarized financial information concerning our segments as of December 31 is shown in the following tables. North America – other
includes Canada, Puerto Rico, the Dominican Republic, Avon Salon and Spa and U.S. Retail.
Total Revenue & Operating Profit
2005 2004 2003
Total Operating Total Operating Total Operating
Revenue Profit Revenue Profit Revenue Profit
North America
U.S. $2,140.7 $ 314.6 $2,287.6 $ 377.2 $2,262.2 $ 420.9
Other 369.8 38.9 344.7 34.2 312.3 5.0
Total 2,510.5 353.5 2,632.3 411.4 2,574.5 425.9
International
Europe 2,291.4 458.9 2,102.2 471.7 1,613.1 313.4
Latin America 2,272.6 516.0 1,934.6 479.1 1,717.9 406.3
Asia Pacific 1,075.1 141.5 1,078.7 192.7 939.6 156.6
Total 5,639.1 1,116.4 5,115.5 1,143.5 4,270.6 876.3
Total from operations 8,149.6 1,469.9 7,747.8 1,554.9 6,845.1 1,302.2
Global expenses* – (320.9) – (325.9) – (259.4)
Total $8,149.6 $1,149.0 $7,747.8 $1,229.0 $6,845.1 $1,042.8
* Global expenses in 2004 and 2003 included benefits of $3.2 and $3.9, respectively, related to releases of 2001 and 2002 restructuring reserves. Restructuring
charges recorded in 2005 were reflected in the respective segment’s operating profit, and restructuring charges associated with corporate departments recorded
in 2005 were reflected in Global expenses.