Avon 2005 Annual Report Download - page 57
Download and view the complete annual report
Please find page 57 of the 2005 Avon annual report below. You can navigate through the pages in the report by either clicking on the pages listed below, or by using the keyword search tool below to find specific information within the annual report.-
 1
1 -
2
-
3
-
4
-
5
-
6
-
7
-
8
-
9
-
10
-
11
-
12
-
13
-
14
-
15
-
16
-
17
-
18
-
19
-
20
-
21
-
22
-
23
-
24
-
25
-
26
-
27
-
28
-
29
-
30
-
31
-
32
-
33
-
34
-
35
-
36
-
37
-
38
-
39
-
40
-
41
-
42
-
43
-
44
-
45
-
46
-
 47
47 -
 48
48 -
 49
49 -
 50
50 -
 51
51 -
 52
52 -
 53
53 -
 54
54 -
 55
55 -
 56
56 -
 57
57
 |
 |

2005ANNUALREPORT77
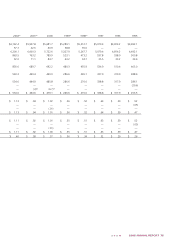
In millions, except per share and employee data 2005(2) 2004 2003 2002(3) 2001(4) 2000 1999(5) 1998(5) 1997 1996 1995
Balance sheet data
Working capital $ 419.3 $ 896.9 $ 619.1 $ 72.7 $ 428.1 $ 186.4 $ (375.0) $ 11.9 $ (11.9) $ (41.7) $ (30.3)
Capital expenditures 206.8 250.1 162.6 126.5 155.3 193.5 200.2 189.5 169.4 103.6 72.7
Property, plant and equipment, net 1,050.8 1,014.8 855.6 769.1 771.7 765.7 732.1 669.9 611.0 566.6 537.8
Total assets 4,763.3 4,148.1 3,562.3 3,327.5 3,181.0 2,811.3 2,512.8 2,433.5 2,272.9 2,222.4 2,052.8
Debt maturing within one year 882.5 51.7 244.1 605.2 88.8 105.4 306.0 55.3 132.1 97.1 47.3
Long-term debt 766.5 866.3 877.7 767.0 1,236.3 1,108.2 701.4 201.0 102.2 104.5 114.2
Total debt 1,649.0 918.0 1,121.8 1,372.2 1,325.1 1,213.6 1,007.4 256.3 234.3 201.6 161.5
Shareholders’ equity (deficit) 794.2 950.2 371.3 (127.7) (75.1) (230.9) (421.9) 285.1 285.0 241.7 192.7
Number of employees
United States 8,700 8,900 9,400 9,200 9,600 9,800 9,700 8,000 8,100 7,800 8,000
International 40,300 38,800 36,500 36,100 34,200 33,200 30,800 25,900 26,900 25,900 23,800
Total employees(9) 49,000 47,700 45,900 45,300 43,800 43,000 40,500 33,900 35,000 33,700 31,800
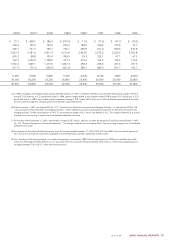
(5) In 1998, we began a worldwide business process redesign program in order to streamline operations and recorded restructuring charges of $154.4
pretax ($122.8 after tax, or $.23 per diluted share). In 1999, special charges related to this program totaled $136.4 pretax ($111.9 after tax, or $.22
per diluted share). In 1999, we recorded an asset impairment charge of $38.1 pretax ($24.0 after tax, or $.05 per diluted share) related to the write-
off of an order management software system that had been under development.
(6) Effective January 1, 2001, we adopted FAS No. 133, “Accounting for Derivative Instruments and Hedging Activities,” as amended by FAS No. 138,
“Accounting for Certain Derivatives and Hedging Activities,” which establishes accounting and reporting standards for derivative instruments and
hedging activities. To reflect the adoption of FAS 133, we recorded a charge of $0.3, net of a tax benefit of $0.2. This charge is reflected as a cumula-
tive effect of an accounting change in the Consolidated Statements of Income.
(7) For the year ended December 31, 2000, we recorded a charge of $6.7 million, after tax, to reflect the adoption of Staff Accounting Bulletin (“SAB”)
No. 101, “Revenue Recognition in Financial Statements.” This charge is reflected as a cumulative effect of an accounting change in the Consolidated
Statements of Income.
(8) For purposes of calculating diluted earnings per share for the years ended December 31, 2003, 2002, 2001 and 2000, after tax interest expense of
$5.7, $10.4, $10.0 and $4.5, respectively, applicable to Convertible Notes, has been added back to Net income.
(9) Our calculation of full-time equivalents, or number of employees, was revised in 1999. Data for periods prior to 1999 are not available for restate-
ments. For 2005, approximately 28% of our U.S. associates were men, and men held approximately 23% of all U.S. officer and manager positions,
and approximately 15% of all U.S. office and clerical positions.