Avon 2001 Annual Report Download - page 7
Download and view the complete annual report
Please find page 7 of the 2001 Avon annual report below. You can navigate through the pages in the report by either clicking on the pages listed below, or by using the keyword search tool below to find specific information within the annual report.-
 1
1 -
 2
2 -
 3
3 -
 4
4 -
 5
5 -
 6
6 -
 7
7 -
 8
8 -
 9
9 -
 10
10 -
 11
11 -
 12
12 -
 13
13 -
 14
14 -
 15
15 -
 16
16 -
 17
17 -
 18
18 -
19
-
20
-
21
-
22
-
23
-
24
-
25
-
26
-
27
-
28
-
29
-
30
-
31
-
32
-
33
-
34
-
35
-
36
-
37
-
38
-
39
-
40
-
41
-
42
-
43
-
44
-
45
-
46
-
47
-
48
-
49
 |
 |

PAGE 30
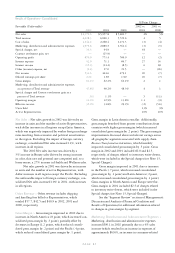
Segment Review
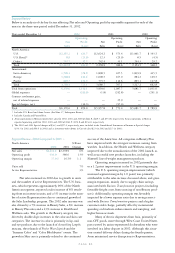
Below is an analysis of the key factors affecting Net sales and Operating profit by reportable segment for each of the
years in the three-year period ended December 31, 2002.
Years ended December 31 2002 2001 2000
Operating Operating Operating
Net Profit Net Profit Net Profit
Sales (Loss) Sales (Loss) Sales (Loss)
North America:
U.S. $ 2,151.2 $ 424.7 $ 2,024.2 $ 373.4 $ 1,901.7 $ 343.5
U.S. Retail* 8.8 (25.9) 12.3 (25.9) 8.5 (4.5)
Other†252.2 32.2 242.4 33.1 244.3 29.2
Total $ 2,412.2 431.0 2,278.9 380.6 2,154.5 368.2
International:
Latin America‡1,700.1 378.8 1,898.5 427.5 1,839.9 415.5
Europe 1,228.6 212.4 1,008.5 167.0 884.2 129.5
Pacific 829.7 133.9 773.7 112.6 803.1 117.8
Total 3,758.4 725.1 3,680.7 707.1 3,527.2 662.8
Total from operations 6,170.6 1,156.1 5,959.6 1,087.7 5,681.7 1,031.0
Global expenses — (249.8) (1.8) (242.8) — (241.1)
Contract settlement gain,
net of related expenses ——— 25.9 — —
Special charges, net§—(36.3) — (97.4) — —
Total $ 6,170.6 $ 870.0 $ 5,957.8 $ 773.4 $ 5,681.7 $ 789.9
* Includes U.S. Retail and Avon Centre. (See Note 17, Subsequent Events).
† Includes Canada and Puerto Rico.
‡ Avon’s operations in Mexico reported net sales for 2002, 2001 and 2000 of $661.8, $619.7 and $554.8, respectively. Avon’s operations in Mexico
reported operating profit for 2002, 2001 and 2000 of $163.9, $154.8 and $136.0, respectively.
§ The 2002 and 2001 Special charges of $36.3 and $97.4, respectively, were included in the Consolidated Statements of Income as Special charges
($34.3 in 2002 and $94.9 in 2001) and as inventory write-downs in Cost of sales ($2.0 in 2002 and $2.5 in 2001).
Segment Review–2002 Compared to 2001 >
North America %/Point
2002 2001 Change
Net sales $2,412.2 $2,278.9 6%
Operating profit 431.0 380.6 13%
Operating margin 17.6% 16.5% 1.1
Units sold 7%
Active Representatives 3%
Net sales increased in 2002 due to growth in units
and the number of active Representatives. The U.S. busi-
ness, which represents approximately 90% of the North
American segment, reported a sales increase of 6% result-
ing from an increase in units, and a 3% increase in the num-
ber of active Representatives due to continued growth of
the Sales Leadership program. The 2002 sales increase was
also driven by a 7% increase in Beauty Sales, a 6% increase
in Beauty Plus sales and a 43% increase in Health and
Wellness sales. The growth in the Beauty category was
driven by double-digit increases in the color and skin care
categories. The increase in color is primarily in lip, nail
and eye products due to the launch of Astonishing Lengths
mascara, the relaunch of Perfect Wear Lipstick and the
“Summer Color” and “Color Blockbuster” events. The
growth in Skin care is primarily related to the continued
success of the Anew line. All categories in Beauty Plus
have improved with the strongest increases coming from
watches. In addition, the Health and Wellness category
improved due to the annualization of the 2001 launch, as
well as successful new product launches, including the
Slimwell line of weight management products.
Operating margin increased in 2002 primarily due
to a 1.2 point improvement in the U.S. operating margin.
The U.S. operating margin improvement (which
increased segment margin by 1.0 point) was primarily
attributable to the sales increase discussed above, and gross
margin expansion, mainly due to supply chain savings
associated with Business Transformation projects (including
favorable freight costs from sourcing of non-Beauty prod-
ucts). Additionally, operating margin was favorably
impacted by a lower expense ratio due to savings associ-
ated with Business Transformation projects and a higher
customer order charge, partially offset by incremental
spending on brochure enhancements and sampling, and
higher bonus accruals.
Many of Avon’s shipments from Asia, primarily of
non-CFT goods, move through West Coast United States
ports served by union-represented dockworkers who were
involved in a labor dispute in 2002. Although this situa-
tion created delivery delays during the fourth quarter,
Avon minimized service disruptions to Representatives.