Avon 2001 Annual Report Download - page 39
Download and view the complete annual report
Please find page 39 of the 2001 Avon annual report below. You can navigate through the pages in the report by either clicking on the pages listed below, or by using the keyword search tool below to find specific information within the annual report.-
 1
1 -
2
-
3
-
4
-
5
-
6
-
7
-
8
-
9
-
10
-
11
-
12
-
13
-
14
-
15
-
16
-
17
-
18
-
19
-
20
-
21
-
22
-
23
-
24
-
25
-
26
-
27
-
28
-
 29
29 -
 30
30 -
 31
31 -
 32
32 -
 33
33 -
 34
34 -
 35
35 -
 36
36 -
 37
37 -
 38
38 -
 39
39 -
 40
40 -
 41
41 -
 42
42 -
 43
43 -
 44
44 -
 45
45 -
 46
46 -
 47
47 -
 48
48 -
 49
49
 |
 |

PAGE 63
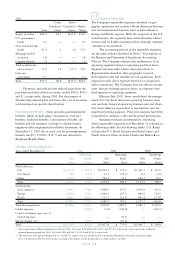
2001
Gross Gross
Unrealized Unrealized Market
Cost Gains Losses Value
Equity securities $44.4 $1.5 $(15.2) $30.7
U.S. government
bonds 2.1 — — 2.1
State and municipal
bonds 21.9 .4 (.1) 22.2
Mortgage backed
securities 2.8 — — 2.8
Corporate Bonds .6 — — .6
Total available-for-
sale securities 71.8 1.9 (15.3) 58.4
Cash and
equivalents 3.7 — — 3.7
Total $75.5 $1.9 $(15.3) $62.1
Payments, proceeds and net realized gains from the
purchases and sales of these securities totaled $50.9, $58.3
and $.1, respectively, during 2001. For the purpose of
determining realized gains and losses, the cost of securities
sold was based on specific identification.
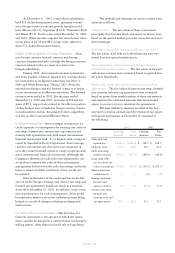
Postemployment Benefits > Avon provides postemployment
benefits, which include salary continuation, severance
benefits, disability benefits, continuation of health care
benefits and life insurance coverage to eligible former
employees after employment but before retirement. At
December 31, 2002, the accrued cost for postemployment
benefits was $37.9 (2001–$32.7) and was included in
Employee Benefit Plans.
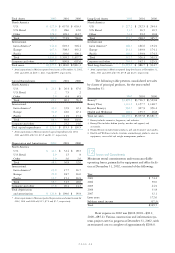
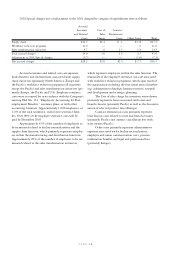
Segment Information
The Company’s reportable segments are based on geo-
graphic operations and include a North American business
unit and international business units in Latin America,
Europe and Pacific regions. With the exception of the U.S.
retail business, the segments have similar business charac-
teristics and each offers similar products through common
customer access methods.
The accounting policies of the reportable segments
are the same as those described in Note 1, Description of
the Business and Summary of Significant Accounting
Policies. The Company evaluates the performance of its
operating segments based on operating profits or losses.
Segment revenues reflect direct sales of products to
Representatives based on their geographic location.
Intersegment sales and transfers are not significant. Each
segment records direct expenses related to its employees
and its operations. The Company does not allocate income
taxes, foreign exchange gains or losses, or corporate over-
head expenses to operating segments.
Effective July 2002, Avon consolidated the manage-
ment of its two Latin American operating business units
into one Latin American operating business unit and, there-
fore, Latin America is presented as one business unit for
segment reporting purposes. Prior year amounts have been
reclassified to conform to the current period presentation.
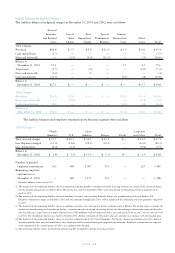
Summarized financial information concerning
Avon’s reportable segments as of December 31 is shown in
the following tables. In the following tables, U.S. Retail
includes the U.S. Retail business and Avon Centre, and
North America Other includes Canada and Puerto Rico.
11
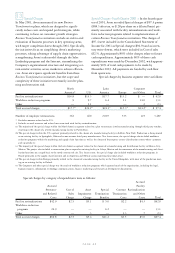
Net Sales and Operating Profit >
Years ended December 31 2002 2001 2000
Operating Operating Operating
Net Profit Net Profit Net Profit
Sales (Loss) Sales (Loss) Sales (Loss)
North America:
U.S. $ 2,151.2 $ 424.7 $ 2,024.2 $ 373.4 $ 1,901.7 $ 343.5
U.S. Retail 8.8 (25.9) 12.3 (25.9) 8.5 (4.5)
Other 252.2 32.2 242.4 33.1 244.3 29.2
Total 2,412.2 431.0 2,278.9 380.6 2,154.5 368.2
International:
Latin America* 1,700.1 378.8 1,898.5 427.5 1,839.9 415.5
Europe 1,228.6 212.4 1,008.5 167.0 884.2 129.5
Pacific 829.7 133.9 773.7 112.6 803.1 117.8
Total 3,758.4 725.1 3,680.7 707.1 3,527.2 662.8
Total from operations 6,170.6 1,156.1 5,959.6 1,087.7 5,681.7 1,031.0
Global expenses — (249.8) (1.8) (242.8) — (241.1)
Contact settlement gain, net of
related expenses ——— 25.9 — —
Special charges, net†— (36.3) — (97.4) — —
Total $ 6,170.6 $ 870.0 $ 5,957.8 $ 773.4 $ 5,681.7 $ 789.9
* Avon’s operations in Mexico reported net sales for 2002, 2001 and 2000 of $661.8, $619.7 and $554.8, respectively. Avon’s operations in Mexico
reported operating profit for 2002, 2001 and 2000 of $163.9, $154.8 and $136.0, respectively.
† The 2002 and 2001 Special charges of $36.3 and $97.4, respectively, are included in the Consolidated Statements of Income as Special charges.
($34.3 in 2002 and $94.9 in 2001) and as inventory write-downs in Cost of sales ($2.0 in 2002 and $2.5 in 2001).