Avon 2001 Annual Report Download - page 34
Download and view the complete annual report
Please find page 34 of the 2001 Avon annual report below. You can navigate through the pages in the report by either clicking on the pages listed below, or by using the keyword search tool below to find specific information within the annual report.-
 1
1 -
2
-
3
-
4
-
5
-
6
-
7
-
8
-
9
-
10
-
11
-
12
-
13
-
14
-
15
-
16
-
17
-
18
-
19
-
20
-
21
-
22
-
23
-
 24
24 -
 25
25 -
 26
26 -
 27
27 -
 28
28 -
 29
29 -
 30
30 -
 31
31 -
 32
32 -
 33
33 -
 34
34 -
 35
35 -
 36
36 -
 37
37 -
 38
38 -
 39
39 -
 40
40 -
 41
41 -
 42
42 -
 43
43 -
 44
44 -
45
-
46
-
47
-
48
-
49
 |
 |

PAGE 58
Long-Term Incentive Plans
The 2000 Stock Incentive Plan (the “2000 Plan”),
provides for several types of equity-based incentive
compensation awards including stock options, stock
appreciation rights, restricted stock, dividend equiva-
lent rights or performance unit awards. Under the 2000
Plan, the maximum number of shares that may be
awarded is 18,250,000 shares, of which no more than
6,000,000 shares may be used for restricted share and
stock bonus grants.
8Stock Options > Under the 2000 Plan, stock options are
awarded annually and generally vest in thirds over the
three-year period following each option grant date. Stock
options are granted at a price no less than fair market value
on the date the option is granted and have a term of 10
years from the date of grant.
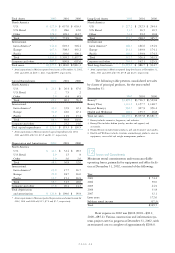
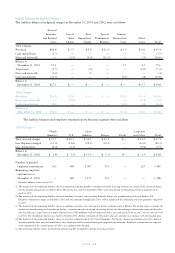
A summary of the Company’s stock option activity, weighted-average exercise price and related information for
the years ended December 31 was as follows:
2000 2001 2002
Weighted Weighted Weighted
Shares Average Shares Average Shares Average
(in 000’s) Price (in 000’s) Price (in 000’s) Price
Outstanding–beginning of year 8,106 $29.38 9,579 $33.47 10,551 $36.33
Granted 3,424 38.28 2,729 41.96 2,859 52.95
Exercised (1,702) 23.94 (1,626) 28.94 (1,996) 32.44
Forfeited (249) 31.68 (131) 36.09 (71) 44.92
Outstanding–end of year 9,579 $33.47 10,551 $36.33 11,343 $41.15
Options exercisable–end of year 4,241 $28.61 4,869 $32.23 5,646 $35.48
The following table summarizes information about stock options outstanding at December 31, 2002:
Options Outstanding Options Exercisable
Shares Average Average Shares Average
Exercise Prices (in 000’s) Price Term (in 000’s) Shares
$13.13–29.63 525 $21.61 4 years 525 $21.61
30.06–39.91 5,181 36.20 6 years 4,170 35.70
40.16–54.81 5,637 47.53 9 years 951 42.20
11,343 5,646
The Company adopted the disclosure provisions of
FAS No. 123, “Accounting for Stock-Based Compensa-
tion,” in lieu of recording the value of the compensation
costs of the 2000 Plan, as permitted by FAS No. 123.
Had compensation cost for the plans been based on the
fair value at the grant dates for awards under those plans
consistent with the method prescribed by FAS No. 123,
Net income and Earnings per share (after the cumulative
effect of the accounting change) would have been the pro
forma amounts indicated below:
2002 2001 2000
Pro forma Net income $504.5 $417.0 $462.3
Pro forma Earnings per share:
Basic $ 2.14 $ 1.76 $ 1.94
Diluted $ 2.10 $ 1.74 $ 1.92
The fair value for these options was estimated at the
date of grant using a Black-Scholes option pricing model
with the following weighted-average assumptions:
2002 2001 2000
Risk-free interest rate 4.6% 4.7% 6.7%
Expected life 5 years 5 years 5 years
Expected volatility 45% 40% 40%
Expected dividend yield 2.0% 2.0% 2.0%
The weighted-average grant date fair values of
options granted during 2002, 2001 and 2000 were
$19.09, $12.05 and $11.73, respectively.
Restricted Stock > During 2002, 2001 and 2000, restricted
shares with aggregate value and vesting and related amor-
tization periods were granted as follows: 2002–79,300
valued at $4.2 vesting over three years; 2001–143,500
valued at $6.2 vesting over three years and 2000–261,700
valued at $10.2 vesting over one to three years.