Avon 2001 Annual Report Download - page 22
Download and view the complete annual report
Please find page 22 of the 2001 Avon annual report below. You can navigate through the pages in the report by either clicking on the pages listed below, or by using the keyword search tool below to find specific information within the annual report.-
 1
1 -
2
-
3
-
4
-
5
-
6
-
7
-
8
-
9
-
10
-
11
-
 12
12 -
 13
13 -
 14
14 -
 15
15 -
 16
16 -
 17
17 -
 18
18 -
 19
19 -
 20
20 -
 21
21 -
 22
22 -
 23
23 -
 24
24 -
 25
25 -
 26
26 -
 27
27 -
 28
28 -
 29
29 -
 30
30 -
 31
31 -
 32
32 -
33
-
34
-
35
-
36
-
37
-
38
-
39
-
40
-
41
-
42
-
43
-
44
-
45
-
46
-
47
-
48
-
49
 |
 |

PAGE 46
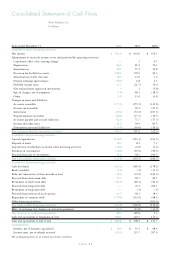
Consolidated Statements of Cash Flows
Avon Products, Inc.
In millions
Years ended December 31 2002 2001 2000
Cash flows from operating activities
Net income $ 534.6 $ 444.6 $ 479.1
Adjustments to reconcile income to net cash provided by operating activities:
Cumulative effect of accounting change —.3 6.7
Depreciation 96.3 81.9 76.1
Amortization 28.5 27.1 19.8
Provision for doubtful accounts 108.3 105.6 94.3
Amortization of debt discount 18.1 14.9 1.4
Foreign exchange (gains) losses (20.3) 6.8 2.7
Deferred income taxes 31.1 (21.7) 14.0
Net realized losses (gains) on investments .5 .1 (5.8)
Special charges, net of payments (7.6) 89.1 (18.3)
Other 13.0 15.9 13.8
Changes in assets and liabilities:
Accounts receivable (177.3) (155.5) (145.6)
Income tax receivable —95.2 (95.2)
Inventories (29.4) (33.2) (103.3)
Prepaid expenses and other (20.2) (17.7) (30.7)
Accounts payable and accrued liabilities 62.6 71.7 (57.3)
Income and other taxes 41.2 38.4 81.5
Noncurrent assets and liabilities (114.0) (16.0) (10.3)
Net cash provided by operating activities 565.4 747.5 322.9
Cash flows from investing activities
Capital expenditures (126.5) (155.3) (193.5)
Disposal of assets 10.3 8.2 7.2
Acquisitions of subsidiary stock and other investing activities (10.2) (5.0) (1.4)
Purchases of investments (30.4) (50.9) (99.3)
Proceeds from sale of investments 33.8 58.3 100.3
Net cash used by investing activities (123.0) (144.7) (186.7)
Cash flows from financing activities
Cash dividends (191.2) (181.9) (178.2)
Book overdrafts (1.6) (.2) (13.5)
Debt, net (maturities of three months or less) (10.5) (23.0) (194.3)
Proceeds from short-term debt 52.4 99.7 90.5
Retirement of short-term debt (67.0) (89.1) (92.2)
Proceeds from long-term debt —76.5 400.1
Retirement of long-term debt —(.2) (.3)
Proceeds from exercise of stock options 64.7 49.1 38.4
Repurchase of common stock (178.6) (132.9) (68.1)
Other financing activities —— (101.4)
Net cash used by financing activities (331.8) (202.0) (119.0)
Effect of exchange rate changes on cash and equivalents (12.3) (15.0) (11.9)
Net increase in cash and equivalents 98.3 385.8 5.3
Cash and equivalents at beginning of year 508.5 122.7 117.4
Cash and equivalents at end of year $ 606.8 $ 508.5 $ 122.7
Cash paid for:
Interest, net of amounts capitalized $ 38.6 $ 55.3 $ 98.6
Income taxes, net of refunds received 243.9 123.7 207.6
The accompanying notes are an integral part of these statements.