Avon 2001 Annual Report Download - page 40
Download and view the complete annual report
Please find page 40 of the 2001 Avon annual report below. You can navigate through the pages in the report by either clicking on the pages listed below, or by using the keyword search tool below to find specific information within the annual report.-
 1
1 -
2
-
3
-
4
-
5
-
6
-
7
-
8
-
9
-
10
-
11
-
12
-
13
-
14
-
15
-
16
-
17
-
18
-
19
-
20
-
21
-
22
-
23
-
24
-
25
-
26
-
27
-
28
-
29
-
 30
30 -
 31
31 -
 32
32 -
 33
33 -
 34
34 -
 35
35 -
 36
36 -
 37
37 -
 38
38 -
 39
39 -
 40
40 -
 41
41 -
 42
42 -
 43
43 -
 44
44 -
 45
45 -
 46
46 -
 47
47 -
 48
48 -
 49
49
 |
 |

PAGE 64
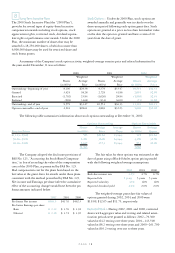
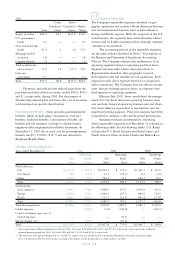
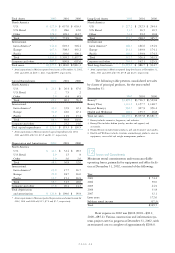
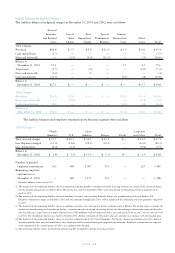
Total Assets 2002 2001 2000
North America
U.S. $ 627.0 $ 637.0 $ 639.3
U.S. Retail 29.8 28.6 12.0
Other 128.2 109.3 114.7
Total 785.0 774.9 766.0
International
Latin America* 541.0 603.3 594.4
Europe 667.3 508.3 443.2
Pacific 426.5 393.6 400.1
Total 1,634.8 1,505.2 1,437.7
Corporate and other 907.7 900.9 607.6
Total assets $3,327.5 $3,181.0 $2,811.3
* Avon’s operations in Mexico reported total assets at December 31, 2002,
2001 and 2000, of $205.7, $211.0 and $189.9, respectively.
Capital Expenditures 2002 2001 2000
North America
U.S. $ 21.1 $ 26.4 $ 67.6
U.S. Retail .2 7.5 .2
Other 2.8 6.4 8.5
Total 24.1 40.3 76.3
International
Latin America* 40.2 35.9 42.1
Europe 39.9 42.0 47.1
Pacific 8.2 11.9 13.4
Total 88.3 89.8 102.6
Corporate and other 14.1 25.2 14.6
Total capital expenditures $ 126.5 $ 155.3 $ 193.5
* Avon’s operations in Mexico reported capital expenditures for 2002,
2001 and 2000 of $21.0, $13.9 and $11.7, respectively.
Depreciation and Amortization 2002 2001 2000
North America
U.S. $ 42.5 $ 32.4 $ 28.5
U.S. Retail 2.9 1.5 .9
Other 2.9 3.0 2.6
Total 48.3 36.9 32.0
International
Latin America* 23.0 17.7 16.7
Europe 22.0 18.7 16.0
Pacific 13.7 15.3 16.9
Total 58.7 51.7 49.6
Corporate and other 17.8 20.4 14.3
Total depreciation
and amortization $ 124.8 $ 109.0 $ 95.9
* Avon’s operations in Mexico reported depreciation and amortization for
2002, 2001 and 2000 of $12.5, $7.0 and $5.7, respectively.
Long-Lived Assets 2002 2001 2000
North America
U.S. $ 227.2 $ 252.5 $ 264.4
U.S. Retail 13.7 16.5 10.5
Other 33.8 29.2 30.8
Total 274.7 298.2 305.7
International
Latin America* 148.7 166.6 154.9
Europe 233.1 199.9 174.1
Pacific 160.9 159.9 174.5
Total 542.7 526.4 503.5
Corporate and other 201.6 162.1 125.5
Total long-lived assets $1,019.0 $ 986.7 $ 934.7
* Avon’s operations in Mexico reported long-lived assets at December 31,
2002, 2001 and 2000 of $73.8, $73.8 and $62.5, respectively.
The following table presents consolidated net sales
by classes of principal products, for the years ended
December 31:
2002 2001 2000
Beauty* $3,895.4 $3,716.5 $3,529.8
Beauty Plus†1,144.5 1,157.7 1,148.7
Beyond Beauty‡932.7 927.9 956.4
Health and Wellness§198.0 155.7 46.8
Total net sales $6,170.6 $5,957.8 $5,681.7
* Beauty includes cosmetics, fragrances, and toiletries.
† Beauty Plus includes fashion jewelry, watches and apparel, and
accessories.
‡ Beyond Beauty includes home products, gift and decorative and candles.
§ Health and Wellness includes vitamins, aromatherapy products, exercise
equipment, stress relief and weight management products.
Leases and Commitments
Minimum rental commitments under noncancellable
operating leases, primarily for equipment and office facili-
ties at December 31, 2002, consisted of the following:
Year
2003 $ 74.4
2004 59.0
2005 44.9
2006 33.8
2007 32.1
Later years 172.6
Sublease rental income (17.3)
Total $399.5
Rent expense in 2002 was $90.8 (2001–$92.1;
2000–$85.4). Various construction and information sys-
tems projects were in progress at December 31, 2002, with
an estimated cost to complete of approximately $206.0.
12