Avon 2001 Annual Report Download - page 38
Download and view the complete annual report
Please find page 38 of the 2001 Avon annual report below. You can navigate through the pages in the report by either clicking on the pages listed below, or by using the keyword search tool below to find specific information within the annual report.-
 1
1 -
2
-
3
-
4
-
5
-
6
-
7
-
8
-
9
-
10
-
11
-
12
-
13
-
14
-
15
-
16
-
17
-
18
-
19
-
20
-
21
-
22
-
23
-
24
-
25
-
26
-
27
-
 28
28 -
 29
29 -
 30
30 -
 31
31 -
 32
32 -
 33
33 -
 34
34 -
 35
35 -
 36
36 -
 37
37 -
 38
38 -
 39
39 -
 40
40 -
 41
41 -
 42
42 -
 43
43 -
 44
44 -
 45
45 -
 46
46 -
 47
47 -
 48
48 -
49
 |
 |

PAGE 62
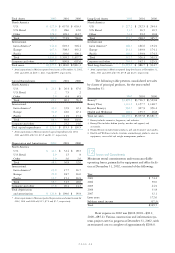
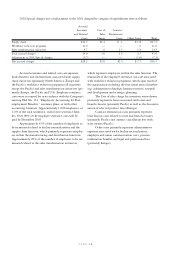
For 2002, the assumed rate of future increases in the
per capita cost of health care benefits (the health care cost
trend rate) was 8% for pre-age 65 claims and post-age 65
claims and will gradually decrease each year thereafter to
5.0% in 2005 and beyond. A one-percentage point change
in the assumed health care cost trend rates would have the
following effects:
1 Percentage 1 Percentage
(In millions) Point Increase Point Decrease
Effect on total of
service and interest
cost components $ .3 $ (.3)
Effect on postretirement
benefit obligation 3.2 (3.2)
Supplemental Retirement Programs > Avon offers a Deferred
Compensation Plan (the “Plan”) for those employees who
are eligible to participate in the Company’s Long Term
Incentive Plan and are on the U.S. payroll. The Plan is an
unfunded, unsecured plan for which obligations are paid
to participants out of the Company’s general assets,
including assets held in a grantors trust, described below,
and corporate-owned life insurance policies. The Plan
allows for the deferral of all or part of a participant’s base
salary, incentive compensation bonuses and any excess per-
sonal savings account contributions over specified annual
limits up to 6% of base salary. Participants may elect to
have their deferred compensation invested in one or more
of four investment alternatives. Expense associated with
the Plan for the years ended December 31, 2002, 2001
and 2000, was $5.3, $5.4 and $5.0, respectively. At
December 31, 2002, the accrued cost for deferred compen-
sation plan was $75.9 (2001–$72.0) and was included in
Other liabilities.
Avon maintains a supplemental retirement program
consisting of a Supplemental Executive Retirement and
Life Plan (“SERP”) and a Benefits Restoration Pension
Plan (“Restoration Plan”) under which non-qualified sup-
plemental pension benefits are paid to higher paid
employees in addition to amounts received under Avon’s
qualified retirement plan which is subject to IRS limita-
tions on covered compensation. The annual cost of this
program has been included in the determination of the net
periodic benefit cost shown above and in 2002 amounted
to $9.7 (2001–$10.5, 2000–$10.2). The benefit obliga-
tion under this program at December 31, 2002 was $40.6
(2001–$35.5) and was primarily included in Employee
Benefit Plans.
Avon also maintains a Supplemental Life Insurance
Plan (“SLIP”) under which additional death benefits rang-
ing from $.35 to $2.0 are provided to certain active and
retired officers.
Avon established a grantors trust to provide funding
for the benefits payable under the SERP and SLIP and to
provide for funding of obligations under Avon’s Deferred
Compensation Plan. The trust is irrevocable and, although
subject to creditors’ claims, assets contributed to the trust
can only be used to pay such benefits with certain excep-
tions. The assets held in the trust at December 31, 2002,
amounting to $77.2 (2001–$88.7), consisted of a fixed-
income portfolio, a managed portfolio of equity securities,
corporate-owned life insurance policies and cash and cash
equivalents. These assets are included in Other assets. The
cash surrender value of the corporate-owned life insurance
policies at December 31, 2002 was $27.6 (2001–$26.6).
Additionally, Avon held assets at December 31,
2002 amounting to $10.1 to fund other benefit payments.
The assets consisted of corporate-owned life insurance
policies with a cash surrender value of $8.3 and mutual
funds with a market value of $1.8.
The equity securities and fixed-income portfolio
included in the grantors trust and the mutual funds, dis-
cussed above, are classified as available-for-sale and
recorded at current market value. In 2002 and 2001, net
unrealized gains and losses on these securities were
recorded in Accumulated other comprehensive loss (see
Note 5, Accumulated Other Comprehensive Loss).
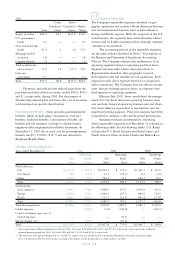
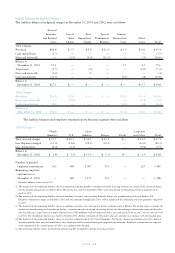
The cost, gross unrealized gains and losses and
market value of the available-for-sale securities as of
December 31, were as follows:
2002
Gross Gross
Unrealized Unrealized Market
Cost Gains Losses Value
Equity securities $44.0 $ .7 $(20.8) $23.9
U.S. government
bonds* 2.3 .1 — 2.4
State and municipal
bonds* 20.1 1.0 — 21.1
Mortgage backed
securities* .7 .1 — .8
Other 3.8 — (1.2) 2.6
Total available-for-
sale securities 70.9 1.9 (22.0) 50.8
Cash and
equivalents .6 — — .6
Total $71.5 $1.9 $(22.0) $51.4
* At December 31, 2002, investments with scheduled maturities in two to
five years totaled $11.0 and after five years totaled $12.1.
Payments, proceeds and net realized losses from the
purchases and sales of these securities totaled $30.4, $33.8
and $.5, respectively, during 2002.