Avon 2001 Annual Report Download - page 37
Download and view the complete annual report
Please find page 37 of the 2001 Avon annual report below. You can navigate through the pages in the report by either clicking on the pages listed below, or by using the keyword search tool below to find specific information within the annual report.-
 1
1 -
2
-
3
-
4
-
5
-
6
-
7
-
8
-
9
-
10
-
11
-
12
-
13
-
14
-
15
-
16
-
17
-
18
-
19
-
20
-
21
-
22
-
23
-
24
-
25
-
26
-
 27
27 -
 28
28 -
 29
29 -
 30
30 -
 31
31 -
 32
32 -
 33
33 -
 34
34 -
 35
35 -
 36
36 -
 37
37 -
 38
38 -
 39
39 -
 40
40 -
 41
41 -
 42
42 -
 43
43 -
 44
44 -
 45
45 -
 46
46 -
 47
47 -
48
-
49
 |
 |

PAGE 61
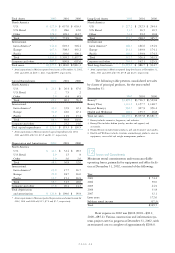
Pension Benefits
U.S. Plans Non-U.S. Plans
2002 2001 2002 2001
Projected benefit obligation $659.0 $84.1 $412.5 $346.3
Accumulated benefit obligation 605.7 68.2 385.6 319.8
Fair value plan assets 475.8 10.9 173.5 167.3
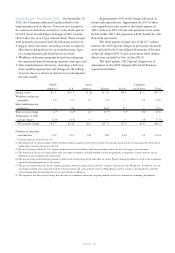
In 2002 and 2001, the plan assets experienced
weaker investment returns, which was mostly due to unfa-
vorable returns on equity securities. These unfavorable
investment returns will increase pension costs in 2003.
In addition, net periodic pension cost may significantly
increase in the future if settlement losses are required to be
recorded due to an increase in the aggregate benefits paid
as lump sum distributions. Settlement losses may result in
the future if the number of eligible participants deciding
to receive lump sum distributions and the amount of
their benefits increases.
Special termination benefits and settlements or
curtailments primarily represent the impact of employee
terminations on the Company’s benefits plans in the
U.S. and certain international locations (see Note 13,
Special charges).
The weighted-average assumptions used to
determine the data for the years ended December 31
were as follows:
Pension Benefits
U.S. Plans Non-U.S. Plans Postretirement Benefits
2002 2001 2000 2002 2001 2000 2002 2001 2000
Discount rate 7.3% 7.8% 8.0% 6.0% 6.1% 6.0% 7.3% 7.8% 8.0%
Rate of compensation increase 4.5 4.5 4.5 3.1 3.3 3.3 4.5 4.5 4.5
Rate of return on assets 8.8 9.5 9.5 7.5 7.5 7.5 N/A N/A N/A
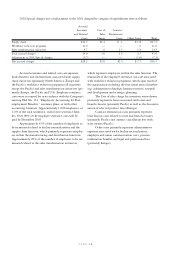
The projected benefit obligation, accumulated
benefit obligation and fair value of plan assets for pension
benefit plans with accumulated benefit obligations in
excess of plan assets as of December 31, 2002 and 2001
were as follows:
In 2001, the qualified plan covering U.S.-based employees did not have an accumulated benefit obligation in
excess of plan assets, which results in a large variance in 2002 as compared to 2001.
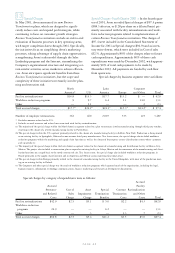
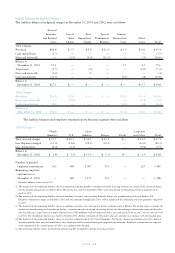
Net periodic benefit cost for the years ended December 31 was determined as follows:
Pension Benefits
U.S. Plans Non-U.S. Plans Postretirement Benefits
2002 2001 2000 2002 2001 2000 2002 2001 2000
Service cost $ 19.0 $ 18.7 $ 18.4 $ 18.8 $ 15.6 $ 18.1 $ 2.2 $ 1.2 $ 1.9
Interest cost 43.6 41.9 43.2 25.4 23.3 22.4 12.5 10.7 11.2
Expected return on plan assets (53.2) (49.3) (47.9) (20.9) (18.8) (18.7) ———
Amortization of transition
liability ——— .5 .2 (.7) ———
Amortization of prior
service cost 1.5 (.1) (.2) 1.4 1.1 1.2 (4.1) (3.9) —
Amortization of actuarial
losses (gains) 1.4 2.3 3.6 2.8 1.7 2.0 .7 (.3) (3.8)
Settlements or curtailments —2.5 — 2.6 — (1.2) —(2.1) —
Special termination benefits —9.4 2.5 ————.7 —
Other ———(1.0) (1.1) (.9) ———
Net periodic benefit cost $ 12.3 $ 25.4 $ 19.6 $ 29.6 $ 22.0 $ 22.2 $11.3 $ 6.3 $ 9.3