Avon 2001 Annual Report Download - page 10
Download and view the complete annual report
Please find page 10 of the 2001 Avon annual report below. You can navigate through the pages in the report by either clicking on the pages listed below, or by using the keyword search tool below to find specific information within the annual report.-
 1
1 -
 2
2 -
 3
3 -
 4
4 -
 5
5 -
 6
6 -
 7
7 -
 8
8 -
 9
9 -
 10
10 -
 11
11 -
 12
12 -
 13
13 -
 14
14 -
 15
15 -
 16
16 -
 17
17 -
 18
18 -
 19
19 -
 20
20 -
 21
21 -
22
-
23
-
24
-
25
-
26
-
27
-
28
-
29
-
30
-
31
-
32
-
33
-
34
-
35
-
36
-
37
-
38
-
39
-
40
-
41
-
42
-
43
-
44
-
45
-
46
-
47
-
48
-
49
 |
 |

PAGE 34
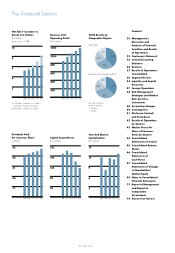
a reduction in shipping and distribution costs as the
shipping systems installed in 2000 were completed
and began to improve productivity.
• In the Ukraine, the operating margin improvement
(which increased segment margin by .6 point) was driven
by an improved expense ratio resulting from sales growth
of 80% in 2001, and an improvement in gross margin,
which benefited from a reduction in import duties.
• In Poland, the operating margin decline (which decreased
segment margin by .1 point) was driven by favorable
foreign exchange on inventory purchases in 2000 and
pricing investments in 2001 to gain market share.
• In South Africa, the operating profit margin decline
(which decreased segment margin by .5 point) was
due to a higher expense ratio, resulting from lower
sales volume.
• In most Western European markets, operating margins
declined (which decreased segment margin by .6 point)
and continued to be negatively impacted by a weak eco-
nomic environment.
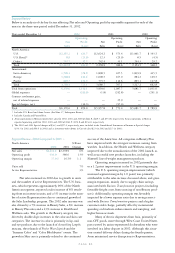
Pacific %/Point Change
Local
2001 2000 US$ Currency
Net sales $773.7 $803.1 (4)% 6%
Operating profit 112.6 117.8 (4)% 6%
Operating margin 14.3% 14.4% (.1) (.1)
Units sold 9%
Active Representatives 8%
In 2001, U.S. dollar sales for most major markets in
the Pacific region were negatively impacted by foreign
exchange, most significantly the Philippines, Japan and
Taiwan. U.S. dollar sales in the Pacific region declined 4%
in 2001, but sales increased 6% in local currency.
• In China, U.S. dollar and local currency sales grew 36%
in 2001, driven by the success of consumer initiatives
and the opening of additional beauty boutiques.
• In Japan, local currency sales increased 2% in 2001
despite the weakness of the local economy.
• In the Philippines, double-digit local currency sales
growth in 2001 resulted primarily from strong increases
in active Representatives, customers and units.
• In Taiwan, U.S. dollar and local currency sales declined
in 2001 due to an economic slowdown, which nega-
tively impacted consumer spending.
The operating margin decline in the Pacific was
most significantly impacted by the following markets:
• In Taiwan, operating margin declined (which decreased
segment margin by .3 point) due to a higher expense
ratio resulting from fixed expenses on lower sales.
• In the Philippines, operating margin declined (which
decreased segment margin by .1 point) resulting from
costs associated with an increase in brochure pages,
partially offset by favorable product mix and pricing.
• In China, operating margin improved significantly
(which increased segment margin by .7 point) due to a
favorable expense ratio resulting from operating expense
leverage as this market achieves scale.
• In Japan, operating margin improved (which increased
segment margin by .2 point) largely driven by process
redesign efforts, which continue to generate significant
savings across all expense areas.
Additionally, operating margin was negatively
impacted by greater contributions from markets with
lower margins (which reduced segment margin by
.3 point).
Global Expenses > Global expenses increased $1.7 in
2001, primarily due to insurance proceeds of $9.7 received
in 2000 related to 1998 hurricane losses in Central
America, 1999 flood losses in Venezuela and 1999 earth-
quake losses in Taiwan, higher realized gains on available-
for-sale securities in 2000 of $5.6 and higher benefit
expenses in 2001 of $5.5, partially offset by savings in
global departmental expenses of $17.8 including such
areas as marketing and information technology systems.
Liquidity and Capital Resources
Avon’s principal sources of funds historically have been
cash flows from operations, commercial paper and borrow-
ings under uncommitted lines of credit.
Cash Flows > Net cash provided by operating activities was
$182.1 unfavorable to 2001. 2002 results reflect increased
U.S. pension plan contributions of $95.0, a tax payment of
$20.0 deferred from 2001 and increased cash payments of
$35.6 associated with restructuring activities. 2001 results
reflect the receipt of a federal income tax refund of $95.2
and the net cash settlement with Sears of $25.9. Excluding
these items, net cash from operations was $109.6 higher
than prior year. This favorability was mainly driven by
higher net income (adjusted for non-cash items).
Excluding the items discussed above, net cash flow
before changes in debt was $93.3 favorable to 2001. This
increase was mainly the result of higher net income, as
well as decreased capital expenditures of $28.8 and higher
proceeds from the exercise of stock options of $15.6, par-
tially offset by higher repurchases of common stock (Avon
purchased approximately 3.5 million shares of Avon
common stock for $178.6 during 2002, compared with
$132.9 spent for the repurchase of approximately 3.3 mil-
lion shares during 2001), and the purchase of company-
owned life insurance policies of $10.0 in 2002.
For the period 1994 through 2002, approximately
66.4 million shares of common stock were purchased
for approximately $1.8 billion under share repurchase
programs. See Note 9, Shareholders’ (Deficit) Equity, for
further details of the share repurchase program.