Asus 2008 Annual Report Download - page 91
Download and view the complete annual report
Please find page 91 of the 2008 Asus annual report below. You can navigate through the pages in the report by either clicking on the pages listed below, or by using the keyword search tool below to find specific information within the annual report.-
 1
1 -
2
-
3
-
4
-
5
-
6
-
7
-
8
-
9
-
10
-
11
-
12
-
13
-
14
-
15
-
16
-
17
-
18
-
19
-
20
-
21
-
22
-
23
-
24
-
25
-
26
-
27
-
28
-
29
-
30
-
31
-
32
-
33
-
34
-
35
-
36
-
37
-
38
-
39
-
40
-
41
-
42
-
43
-
44
-
45
-
46
-
47
-
48
-
49
-
50
-
51
-
52
-
53
-
54
-
55
-
56
-
57
-
58
-
59
-
60
-
61
-
62
-
63
-
64
-
65
-
66
-
67
-
68
-
69
-
70
-
71
-
72
-
73
-
74
-
75
-
76
-
77
-
78
-
79
-
80
-
 81
81 -
 82
82 -
 83
83 -
 84
84 -
 85
85 -
 86
86 -
 87
87 -
 88
88 -
 89
89 -
 90
90 -
 91
91 -
 92
92 -
 93
93 -
 94
94 -
 95
95 -
 96
96 -
 97
97 -
 98
98 -
 99
99 -
 100
100 -
 101
101 -
102
-
103
-
104
-
105
-
106
-
107
-
108
-
109
-
110
-
111
-
112
-
113
-
114
-
115
-
116
-
117
-
118
-
119
-
120
-
121
-
122
-
123
-
124
-
125
-
126
-
127
-
128
-
129
-
130
-
131
-
132
-
133
-
134
-
135
-
136
-
137
-
138
-
139
-
140
-
141
-
142
-
143
-
144
-
145
-
146
-
147
-
148
-
149
-
150
-
151
-
152
-
153
-
154
-
155
-
156
-
157
-
158
-
159
-
160
-
161
-
162
-
163
-
164
-
165
-
166
-
167
-
168
-
169
-
170
-
171
-
172
-
173
-
174
-
175
-
176
-
177
-
178
-
179
-
180
-
181
-
182
-
183
-
184
-
185
-
186
-
187
-
188
-
189
-
190
-
191
-
192
-
193
-
194
-
195
-
196
-
197
-
198
-
199
-
200
-
201
-
202
-
203
-
204
-
205
-
206
-
207
-
208
-
209
-
210
-
211
-
212
-
213
-
214
-
215
-
216
-
217
-
218
-
219
-
220
-
221
-
222
-
223
-
224
-
225
-
226
-
227
-
228
-
229
-
230
-
231
-
232
-
233
-
234
-
235
-
236
-
237
-
238
-
239
-
240
-
241
-
242
-
243
-
244
-
245
-
246
-
247
-
248
-
249
-
250
-
251
 |
 |

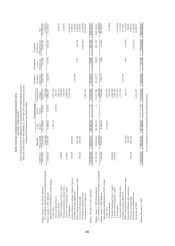
87
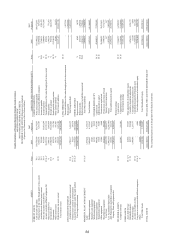
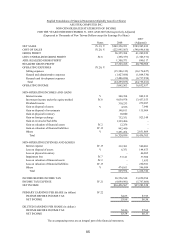
ASUSTEK COMPUTER INC.
NON-CONSOLIDATED STATEMENTS OF CASH FLOWS
(Expressed in Thousands of New Taiwan Dollars)
2007 2007
2008 (Adjusted) 2008 (Adjusted)
CASH FLOWS FROM OPERATING ACTIVITIES: CASH FLOWS FROM INVESTING ACTIVITIES:
Net income $16,456,567 $27,283,328 Purchase of investments (1,617,899) (6,288,285)
Adjustments to reconcile net income to net cash
provided by operating activities:
Proceeds from disposal of investments
-
127,484
Effects of changes in exchange rate for deposit in foreign currency
61,803
(25,299)
Refund from capital reduction
and liquidation of long-term investments
14,245
17,218
Depreciation 211,524 623,247 Purchase of available-for-sale financial assets-current (231,307) -
Amortization 685,728 703,927 Decrease in refundable deposits 159,761 13,011
Depreciation and loss on obsolescence of assets held for lease 2,428 5,898 Acquisition of property, plant and equipment (396,749) (766,005)
Loss on obsolescence of deferred charges - 14,105
Proceeds from disposal of property, plant and equipment
8,742
110,354
Gain on disposal of assets (4,526) (7,040)
Inc
Purchase of deferred charges (853,566) (767,628)
Loss on disposal of assets 6,351 144,675 Proceeds from disposal of deferred charges and intangible assets 18,574 1,194
Loss on obsolescence of property, plant and equipment 6,314 6,465 Purchase of intangible assets (119,330) (172,372)
Property, plant and equipment transferred to other accounts 336 14,609 Decrease in other assets 3,050 63,192
Loss/(Gain) on disposal of investments 82 (68,057)
Cash transferred to spun-off subsidiaries
(2,000,000)
-
Investment income under the equity method (9,039,978) (13,457,553) Net cash used in investing activities (5,014,479) (7,661,837)
Cash dividends received from investees under the equity method 3,822,301 13,561,534
Gain on foreign exchange of bonds payable (74,038) (9,573) CASH FLOWS FROM FINANCING ACTIVITIES:
Amortization of discount and premium on bonds 267,507 264,646 Redemption of bonds payable (483,807) -
Gain on redemption of bonds payable (15,226) - Payments for bonus to employees, directors and supervisors (1,220,106) (380,173)
(Gain)/Loss on valuation of financial liabilities (942,440) 250,921 Payments for cash dividends (9,351,630) (5,118,124)
Shares trust dividends paid to employees 112,124 - (Decrease)/Increase in deposits received (11,721) 1,335
Impairment loss 37,141 37,500 Net cash used in financing activities (11,067,264) (5,496,962)
Amortization of deferred issuing cost of bonds 3,044 8,140
Changes in operating assets and liabilities: Effects of changes in exchange rate (61,803) 25,299
(Increase)/Decrease in financial assets at fair value through profit or loss-current (1,098,026) (3,038,450)
(Increase)/Decrease in notes and accounts receivable-net 61,445,584 19,086,988 NET INCREASE/(DECREASE) IN CASH AND CASH EQUIVALENTS 1,604,090 (1,617,617)
(Increase)/Decrease in accounts receivable-affiliated companies-net 7,419,350 (24,594,218) CASH AND CASH EQUIVALENTS, BEGINNING OF THE YEAR 9,174,219 10,791,836
(Increase)/Decrease in other receivables-net
(2,795,097)
(3,442,527)
CASH AND CASH EQUIVALENTS, END OF THE YEAR
$10,778,309
$9,174,219
(Increase)/Decrease in inventories-net (5,937,618) 18,984,096
(Increase)/Decrease in prepayments (791,396) 40,594 SUPPLEMENTAL DISCLOSURES OF CASH FLOWS INFORMATION:
(Increase)/Decrease in other current assets (59,918) (101,863) Cash paid during the year for:
(Increase)/Decrease in accounts receivable-overdue
-
24
Interest
$42,787
$2,007
(Increase)/Decrease in long-term accounts receivable-affiliated companies
4,998
(2,533)
Income tax
$6,530,673
$3,816,255
(Increase)/Decrease in deferred income tax assets-current (604,772) (565,160)
(Increase)/Decrease in compensating interest receivable (19,475) (54,913)
INVESTING AND FINANCING ACTIVITIES
PARTIALLY AFFECTING CASH FLOWS
Increase/(Decrease) in deferred income tax liabilities-noncurrent 235,528 279,879
Items affected by sp
in-off of subsidiaries
Increase/(Decrease) in notes and accounts payable (44,286,068) (28,857,994) Non-cash assets transferred to spun-off subsidiaries $111,851,499 $-
Increase/(Decrease) in notes and accounts payable-affiliated companies 10,060,835 (8,169,448) Liabilities transferred to spun-off subsidiaries (31,851,499) -
Increase/(Decrease) in accrued expenses (13,428,276) 10,218,477 Acquisition of long-term equity investments from spun-off subsidiaries (82,000,000) -
Increase/(Decrease) in other payables
471,424
(145,500)
Cash transferred to spun-off subsidiaries
$(2,000,000)
$-
Increase/(Decrease) in income tax payable (2,035,341) 2,236,692
Increase/(Decrease) in receipts in advance (1,455,474) (90,534)
INVESTING AND FINANCING ACTIVITIES NOT AFFECTING CASH FLOWS
Increase/(Decrease) in other current liabilities
34,370
(37,454)
Bonds payable converted to capital stock
$1,484,149
$3,510,592
Increase/(Decrease) in deferred credits
(1,010,034)
418,254
Bonus appropriated to employees
$47,623
$447,410
Issuance of shares in exchange of shares of investee
$-
$2,698,526
Net cash provided by operating activities
17,747,636
11,515,883
Bonds payable-current portion
$12,210,103
$-
English Translations of Financial Statements Originally Issued in Chinese
FOR THE YEARS ENDED DECEMBER 31, 2008 AND 2007 (Retrospectively Adjusted)
The accompanying notes are an integral part of the financial statements.