Asus 2008 Annual Report Download - page 81
Download and view the complete annual report
Please find page 81 of the 2008 Asus annual report below. You can navigate through the pages in the report by either clicking on the pages listed below, or by using the keyword search tool below to find specific information within the annual report.-
 1
1 -
2
-
3
-
4
-
5
-
6
-
7
-
8
-
9
-
10
-
11
-
12
-
13
-
14
-
15
-
16
-
17
-
18
-
19
-
20
-
21
-
22
-
23
-
24
-
25
-
26
-
27
-
28
-
29
-
30
-
31
-
32
-
33
-
34
-
35
-
36
-
37
-
38
-
39
-
40
-
41
-
42
-
43
-
44
-
45
-
46
-
47
-
48
-
49
-
50
-
51
-
52
-
53
-
54
-
55
-
56
-
57
-
58
-
59
-
60
-
61
-
62
-
63
-
64
-
65
-
66
-
67
-
68
-
69
-
70
-
 71
71 -
 72
72 -
 73
73 -
 74
74 -
 75
75 -
 76
76 -
 77
77 -
 78
78 -
 79
79 -
 80
80 -
 81
81 -
 82
82 -
 83
83 -
 84
84 -
 85
85 -
 86
86 -
 87
87 -
 88
88 -
 89
89 -
 90
90 -
 91
91 -
92
-
93
-
94
-
95
-
96
-
97
-
98
-
99
-
100
-
101
-
102
-
103
-
104
-
105
-
106
-
107
-
108
-
109
-
110
-
111
-
112
-
113
-
114
-
115
-
116
-
117
-
118
-
119
-
120
-
121
-
122
-
123
-
124
-
125
-
126
-
127
-
128
-
129
-
130
-
131
-
132
-
133
-
134
-
135
-
136
-
137
-
138
-
139
-
140
-
141
-
142
-
143
-
144
-
145
-
146
-
147
-
148
-
149
-
150
-
151
-
152
-
153
-
154
-
155
-
156
-
157
-
158
-
159
-
160
-
161
-
162
-
163
-
164
-
165
-
166
-
167
-
168
-
169
-
170
-
171
-
172
-
173
-
174
-
175
-
176
-
177
-
178
-
179
-
180
-
181
-
182
-
183
-
184
-
185
-
186
-
187
-
188
-
189
-
190
-
191
-
192
-
193
-
194
-
195
-
196
-
197
-
198
-
199
-
200
-
201
-
202
-
203
-
204
-
205
-
206
-
207
-
208
-
209
-
210
-
211
-
212
-
213
-
214
-
215
-
216
-
217
-
218
-
219
-
220
-
221
-
222
-
223
-
224
-
225
-
226
-
227
-
228
-
229
-
230
-
231
-
232
-
233
-
234
-
235
-
236
-
237
-
238
-
239
-
240
-
241
-
242
-
243
-
244
-
245
-
246
-
247
-
248
-
249
-
250
-
251
 |
 |
77
ˊˊʳ
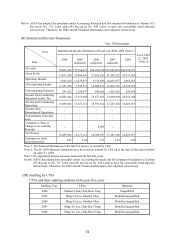
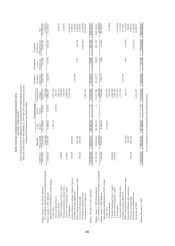
Note 4: ASUS had acquired Askey by stock exchange under Equity Method; therefore, the 2005 financial
statements were adjusted. The 2004 financial statements were published without any adjustment
made retroactively.
Note 5: The Q1 2009 financial statements have not yet been audited by CPA up to the date of the report
printed on April 23, 2009.
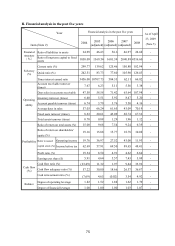
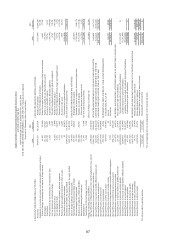
Note 6: Equations:
1. Financial structure
(1) Ratio of liabilities to assets = Total liability/Total assets
(2) Ratio of long-Term capital to fixed assets = (Net shareholders’ equity + Long-term liability)
/ Net fixed assets
2. Solvency
(1) Current ratio = Current assets / current liability
(2) Quick ratio = (Current assets – Inventory – Prepaid expense) / Current liability
(3) Times interest earned ratio = Net income before tax and interest expense / Interest expense
of the year
3. Operating ability
(1) Account receivable turnover (including accounts receivable and notes receivable derived
from business operation) = Net sales / Average accounts receivable (including accounts
receivable and notes receivable derived from business operation)
(2) Days sales in accounts receivable = 365 / Account receivable turnover
(3) Inventory turnover = Cost of goods sold / Average inventory amount
(4) Account payable turnover (including accounts payable and notes payable derived from
business operation) = Cost of goods sold/ Average accounts payable (including accounts
payable and notes payable derived from business operation)
(5) Average days in sales = 365 / Inventory turnover
(6) Fixed assts turnover = Net sales / Net fixed assets
(7) Total assets turnover = Net sales / Total assets
4. Profitability
(1) Return on assets = [Net income (loss) + interest expense x (1-tax rate)] / Average total assets
(2) Return on shareholder’ s equity = Net income (loss) / Net average shareholders’ equity
(3) Ratio to issued capital stock = Net income before tax / Issued capital stock
(4) Profit ratio = Net income (loss) / Net sales
(5) Earnings per share = (Net income – preferred stock dividend) / Weighted average stock
shares issued
5. Cash flow
(1) Cash flow ratio = Net cash flow from operating activity / Current liability
(2) Cash flow adequacy ratio = Net cash flow from operating activity in the past five years /
(Capital expenditure + Inventory increase + Cash dividend) in the past five years
(3) Cash reinvestment ratio = (Net cash flow from operating activity – Cash dividend) / (Fixed
assets + Long-term investment + Other assets + Working capital)
6. Balance:
(1) Degree of operating leverage = (Net operating income – Variable operating cost and expense)
/ Operating income
(2) Degree of financial leverage = Operating income / (Operating income – interest expense)
Note 7: The following factors are to be included for consideration for the calculation of earnings per
share:
1. It is based on the weighted average common stock shares instead of the outstanding stock shares
at yearend.
2. For capitalization with cash or Treasury stock trade, the stock circulation must be included for
consideration to calculate weighted average stock shares.