Asus 2008 Annual Report Download - page 214
Download and view the complete annual report
Please find page 214 of the 2008 Asus annual report below. You can navigate through the pages in the report by either clicking on the pages listed below, or by using the keyword search tool below to find specific information within the annual report.-
 1
1 -
2
-
3
-
4
-
5
-
6
-
7
-
8
-
9
-
10
-
11
-
12
-
13
-
14
-
15
-
16
-
17
-
18
-
19
-
20
-
21
-
22
-
23
-
24
-
25
-
26
-
27
-
28
-
29
-
30
-
31
-
32
-
33
-
34
-
35
-
36
-
37
-
38
-
39
-
40
-
41
-
42
-
43
-
44
-
45
-
46
-
47
-
48
-
49
-
50
-
51
-
52
-
53
-
54
-
55
-
56
-
57
-
58
-
59
-
60
-
61
-
62
-
63
-
64
-
65
-
66
-
67
-
68
-
69
-
70
-
71
-
72
-
73
-
74
-
75
-
76
-
77
-
78
-
79
-
80
-
81
-
82
-
83
-
84
-
85
-
86
-
87
-
88
-
89
-
90
-
91
-
92
-
93
-
94
-
95
-
96
-
97
-
98
-
99
-
100
-
101
-
102
-
103
-
104
-
105
-
106
-
107
-
108
-
109
-
110
-
111
-
112
-
113
-
114
-
115
-
116
-
117
-
118
-
119
-
120
-
121
-
122
-
123
-
124
-
125
-
126
-
127
-
128
-
129
-
130
-
131
-
132
-
133
-
134
-
135
-
136
-
137
-
138
-
139
-
140
-
141
-
142
-
143
-
144
-
145
-
146
-
147
-
148
-
149
-
150
-
151
-
152
-
153
-
154
-
155
-
156
-
157
-
158
-
159
-
160
-
161
-
162
-
163
-
164
-
165
-
166
-
167
-
168
-
169
-
170
-
171
-
172
-
173
-
174
-
175
-
176
-
177
-
178
-
179
-
180
-
181
-
182
-
183
-
184
-
185
-
186
-
187
-
188
-
189
-
190
-
191
-
192
-
193
-
194
-
195
-
196
-
197
-
198
-
199
-
200
-
201
-
202
-
203
-
 204
204 -
 205
205 -
 206
206 -
 207
207 -
 208
208 -
 209
209 -
 210
210 -
 211
211 -
 212
212 -
 213
213 -
 214
214 -
 215
215 -
 216
216 -
 217
217 -
 218
218 -
 219
219 -
 220
220 -
 221
221 -
 222
222 -
 223
223 -
 224
224 -
225
-
226
-
227
-
228
-
229
-
230
-
231
-
232
-
233
-
234
-
235
-
236
-
237
-
238
-
239
-
240
-
241
-
242
-
243
-
244
-
245
-
246
-
247
-
248
-
249
-
250
-
251
 |
 |
210
!
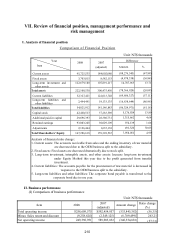
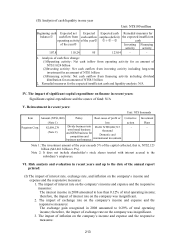
VII. Review of financial position, management performance and
risk management
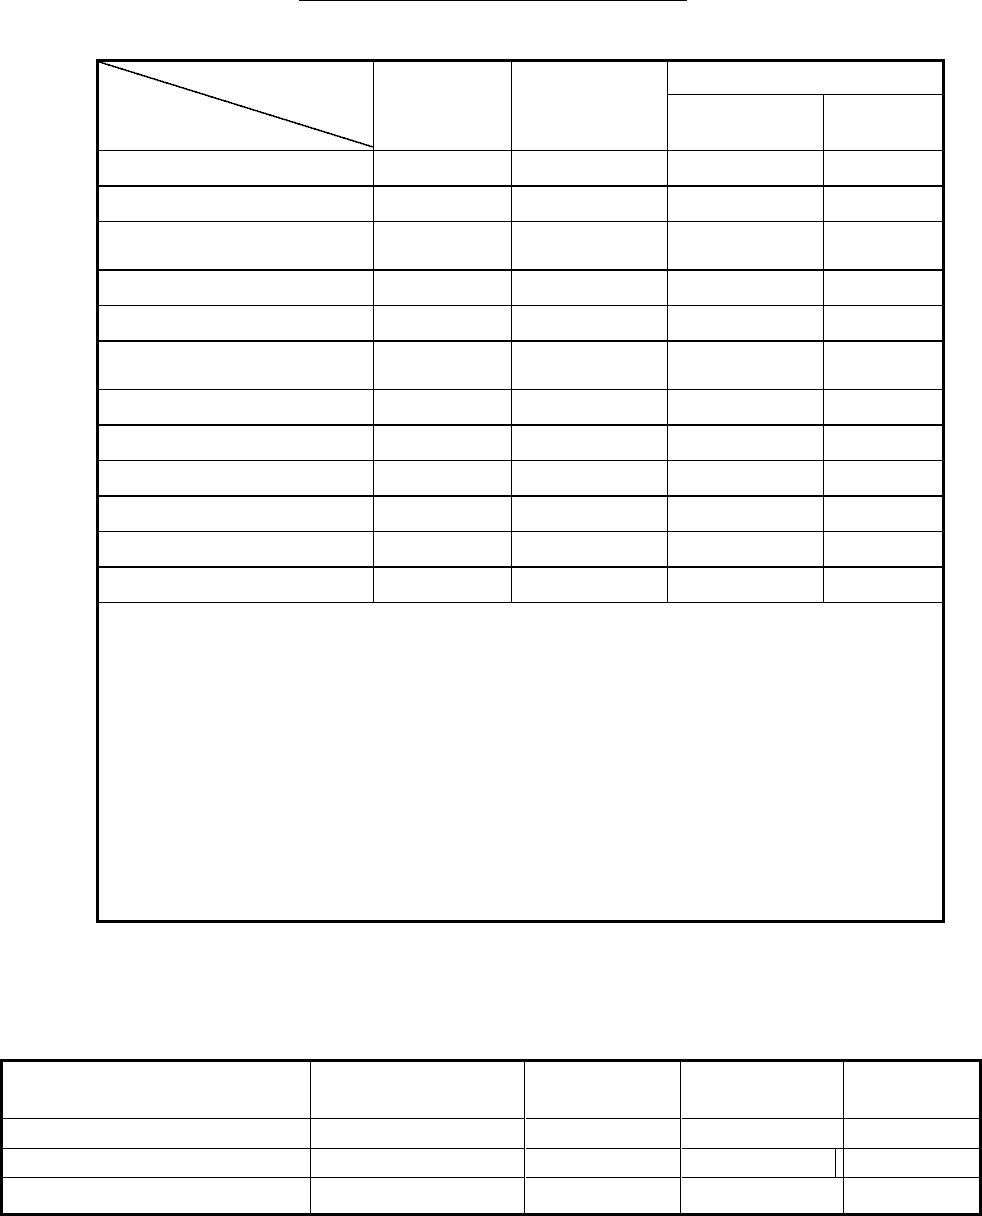
I. Analysis of financial position
Comparison of Financial Position
Unit: NT$ thousands
Difference Year
Item
2008 2007
(adjusted) Amount %
Current assets 95,725,535 184,002,080 (88,276,545) (47.98)
Fixed assets 3,703,815 8,582,153 (4,878,338) (56.84)
Long-term investment and
other assets
122,679,180 107,891,217 14,787,963 13.71
Total assets 222,108,530 300,475,450 (78,366,920) (26.08)
Current liabilities 52,327,421 122,013,748 (69,686,327) (57.11)
Long-term liabilities and
other liabilities 2,494,491 19,133,135 (16,638,644) (86.96)
Total liabilities 54,821,912 141,146,883 (86,324,971) (61.16)
Capital stock 42,460,513 37,283,589 5,176,924 13.89
Additional paid-in capital 29,696,393 28,380,731 1,315,662 4.64
Retained earnings 93,003,248 92,029,109 974,139 1.06
Adjustments 2,126,464 1,635,138 491,326 30.05
Total Shareholders’ Equity 167,286,618 159,328,567 7,958,051 4.99
Analysis of financial ratio change:
1. Current assets: The accounts receivable from sales and the ending inventory of raw material
are decreased due to the OEM business split to the subsidiary.
2. Fixed assets: Fixed assets are decreased dramatically due to stock split.
3. Long-term investment, intangible assets, and other assets: Increase long-term investment
under Equity Method this year due to the profit generated from transfer
investment.
4. Current liabilities: The accounts payable for the procurement of raw material is decreased in
response to the OEM business split to the subsidiary.
5. Long-term liabilities and other liabilities: The corporate bond payable is transferred to the
corporate bond due in one year.
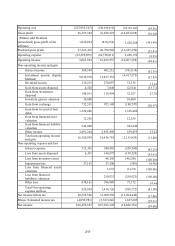
II. Business performance
(I) Comparison of business performance
Unit: NT$ thousands
Item 2008 2007
(adjusted) Amount change Ratio change
(%)
Total operating income $258,609,575 $592,454,957 (333,845,382) (56.35)
Minus: Sales return and discount (9,258,624) (2,549,125) (6,709,499) 263.21
Net operating income 249,350,951 589,905,832 (340,554,881) (57.73)