Asus 2008 Annual Report Download - page 167
Download and view the complete annual report
Please find page 167 of the 2008 Asus annual report below. You can navigate through the pages in the report by either clicking on the pages listed below, or by using the keyword search tool below to find specific information within the annual report.-
 1
1 -
2
-
3
-
4
-
5
-
6
-
7
-
8
-
9
-
10
-
11
-
12
-
13
-
14
-
15
-
16
-
17
-
18
-
19
-
20
-
21
-
22
-
23
-
24
-
25
-
26
-
27
-
28
-
29
-
30
-
31
-
32
-
33
-
34
-
35
-
36
-
37
-
38
-
39
-
40
-
41
-
42
-
43
-
44
-
45
-
46
-
47
-
48
-
49
-
50
-
51
-
52
-
53
-
54
-
55
-
56
-
57
-
58
-
59
-
60
-
61
-
62
-
63
-
64
-
65
-
66
-
67
-
68
-
69
-
70
-
71
-
72
-
73
-
74
-
75
-
76
-
77
-
78
-
79
-
80
-
81
-
82
-
83
-
84
-
85
-
86
-
87
-
88
-
89
-
90
-
91
-
92
-
93
-
94
-
95
-
96
-
97
-
98
-
99
-
100
-
101
-
102
-
103
-
104
-
105
-
106
-
107
-
108
-
109
-
110
-
111
-
112
-
113
-
114
-
115
-
116
-
117
-
118
-
119
-
120
-
121
-
122
-
123
-
124
-
125
-
126
-
127
-
128
-
129
-
130
-
131
-
132
-
133
-
134
-
135
-
136
-
137
-
138
-
139
-
140
-
141
-
142
-
143
-
144
-
145
-
146
-
147
-
148
-
149
-
150
-
151
-
152
-
153
-
154
-
155
-
156
-
 157
157 -
 158
158 -
 159
159 -
 160
160 -
 161
161 -
 162
162 -
 163
163 -
 164
164 -
 165
165 -
 166
166 -
 167
167 -
 168
168 -
 169
169 -
 170
170 -
 171
171 -
 172
172 -
 173
173 -
 174
174 -
 175
175 -
 176
176 -
 177
177 -
178
-
179
-
180
-
181
-
182
-
183
-
184
-
185
-
186
-
187
-
188
-
189
-
190
-
191
-
192
-
193
-
194
-
195
-
196
-
197
-
198
-
199
-
200
-
201
-
202
-
203
-
204
-
205
-
206
-
207
-
208
-
209
-
210
-
211
-
212
-
213
-
214
-
215
-
216
-
217
-
218
-
219
-
220
-
221
-
222
-
223
-
224
-
225
-
226
-
227
-
228
-
229
-
230
-
231
-
232
-
233
-
234
-
235
-
236
-
237
-
238
-
239
-
240
-
241
-
242
-
243
-
244
-
245
-
246
-
247
-
248
-
249
-
250
-
251
 |
 |

163
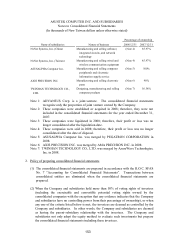
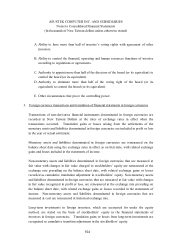
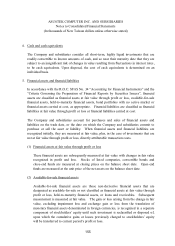
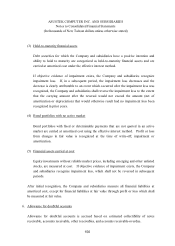
ASUSTEK COMPUTER INC. AND SUBSIDIARIES
Notes to Consolidated Financial Statements
(In thousands of New Taiwan dollars unless otherwise stated)
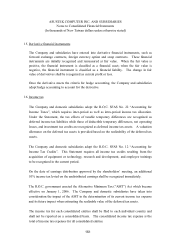
20. Earnings per share (EPS)
Primary EPS is calculated by dividing net income by the weight-average number of shares
outstanding during the period. In the event of capitalization of retained earnings or capital
surplus, the share number is retrospectively adjusted for additional shares issued.
Diluted EPS is calculated by dividing net income by the weighted-average number of
common shares used in the calculation for Primary EPS plus the number of common shares
that would be issued assuming conversion of all potentially dilutive common shares
outstanding.
When the potential common shares are anti-dilutive or the continuing operation of the
Company and subsidiaries incur a loss, the effect of potential common shares shall not affect
the calculation of EPS.
III. REASONS AND EFFECTS OF CHANGES IN ACCOUNTING PRINCIPLES
The Company and subsidiaries adopted Interpretation No. 96-052 by Accounting Research and
Development Foundation to account for its employees’ bonuses and directors’ and supervisors’
remuneration after January 1, 2008. Such a change in accounting principles decreased the
Company and subsidiaries’ net income by $2,033,489 thousand, and, thereby, also decreased
earnings per share by $0.48 for 2008. The Company and subsidiaries adopted the R.O.C.
SFAS No. 39 “Accounting for share-based payment” to account for the transfer of their equity
instruments from the Company and subsidiaries as well as their shareholders to their employees.
Such a change in accounting principles decreased the Company and subsidiaries’ net income by
$290,298 thousand, and, thereby, also decreased earnings per share by $0.07 for 2008.
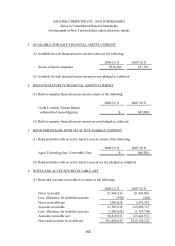
IV. DETAILS OF SIGNIFICANT ACCOUNTS
1. CASH AND CASH EQUIVALENTS
(1) Cash and cash equivalents consist of the following:
2008/12/31
2007/12/31
Cash on hand
$157,215
$33,306
Bank deposits
12,277,493
11,324,027
Time deposits
37,188,791
32,228,450
Cash equivalents
94,968
-
Total
$49,718,467
$43,585,783