Asus 2008 Annual Report Download - page 29
Download and view the complete annual report
Please find page 29 of the 2008 Asus annual report below. You can navigate through the pages in the report by either clicking on the pages listed below, or by using the keyword search tool below to find specific information within the annual report.-
 1
1 -
2
-
3
-
4
-
5
-
6
-
7
-
8
-
9
-
10
-
11
-
12
-
13
-
14
-
15
-
16
-
17
-
18
-
 19
19 -
 20
20 -
 21
21 -
 22
22 -
 23
23 -
 24
24 -
 25
25 -
 26
26 -
 27
27 -
 28
28 -
 29
29 -
 30
30 -
 31
31 -
 32
32 -
 33
33 -
 34
34 -
 35
35 -
 36
36 -
 37
37 -
 38
38 -
 39
39 -
40
-
41
-
42
-
43
-
44
-
45
-
46
-
47
-
48
-
49
-
50
-
51
-
52
-
53
-
54
-
55
-
56
-
57
-
58
-
59
-
60
-
61
-
62
-
63
-
64
-
65
-
66
-
67
-
68
-
69
-
70
-
71
-
72
-
73
-
74
-
75
-
76
-
77
-
78
-
79
-
80
-
81
-
82
-
83
-
84
-
85
-
86
-
87
-
88
-
89
-
90
-
91
-
92
-
93
-
94
-
95
-
96
-
97
-
98
-
99
-
100
-
101
-
102
-
103
-
104
-
105
-
106
-
107
-
108
-
109
-
110
-
111
-
112
-
113
-
114
-
115
-
116
-
117
-
118
-
119
-
120
-
121
-
122
-
123
-
124
-
125
-
126
-
127
-
128
-
129
-
130
-
131
-
132
-
133
-
134
-
135
-
136
-
137
-
138
-
139
-
140
-
141
-
142
-
143
-
144
-
145
-
146
-
147
-
148
-
149
-
150
-
151
-
152
-
153
-
154
-
155
-
156
-
157
-
158
-
159
-
160
-
161
-
162
-
163
-
164
-
165
-
166
-
167
-
168
-
169
-
170
-
171
-
172
-
173
-
174
-
175
-
176
-
177
-
178
-
179
-
180
-
181
-
182
-
183
-
184
-
185
-
186
-
187
-
188
-
189
-
190
-
191
-
192
-
193
-
194
-
195
-
196
-
197
-
198
-
199
-
200
-
201
-
202
-
203
-
204
-
205
-
206
-
207
-
208
-
209
-
210
-
211
-
212
-
213
-
214
-
215
-
216
-
217
-
218
-
219
-
220
-
221
-
222
-
223
-
224
-
225
-
226
-
227
-
228
-
229
-
230
-
231
-
232
-
233
-
234
-
235
-
236
-
237
-
238
-
239
-
240
-
241
-
242
-
243
-
244
-
245
-
246
-
247
-
248
-
249
-
250
-
251
 |
 |

25
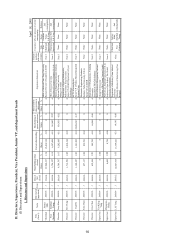
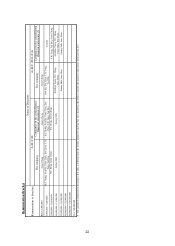
4. Name of Managers who received dividend and the distribution of dividend
Title Name Stock Dividend (estimated
amount) (Note 1)
Cash Dividend (estimated amount)
(Note 1) Total Ra t i o o f to t a l amo u n t t o n et i n co me ( %)
Chief Branding Officer
Jonney Shih
Deputy Chief Branding
Officer Jonathan Tsang
President Jerry Shen
V.P. H.C. Hung
V.P. Tony Chen
V.P. S.Y. Shian
V.P. Joe Hsieh
V.P. PC Wang
V.P. Henry Yeh
V.P. Samson Hu
Managers
Finance & Accounting
Officer David Chang
55,421 thousand 0 55,421 thousand
0.34%
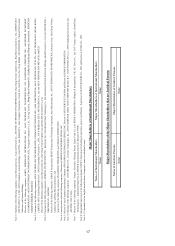
Note 1: For the dividend (including stock dividend and cash dividend) amount to managers that was proposed by the Board of Directors before the Shareholders Meeting for the distribution of
earnings in recent years, if the proposed dividend amount cannot be estimated, it is based on the distribution ratio in the year before. The listed/OTC company is to have the stock dividend
amount calculated according to the fair value (the closing price on the Balance Sheet date) in accordance with the Regulations Governing the Preparation of Financial Statements by
Securities Issuers. Net income meant for the net income in the most recent year.
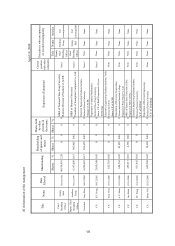
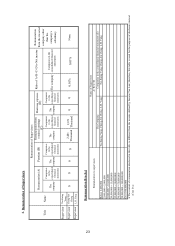
(IV) Compare and state the ratio of total remuneration paid to the company’s Directors, Supervisors, President, and V.P. by the company and the companies
in the consolidated financial statements to net income in the last two years; also, describe the policy, standard, and combination of remuneration paid;
moreover, the procedure of defining remuneration and its relation to business performance:
A. Analyze the ratio of the total remuneration paid to the company’s Directors, Supervisors, President, and V.P. in the last two years to net income:
Year (Note 1) Ratio of the total remuneration paid to the company’
s Directors, Supervisors, President,
and V.P. in the last two years to net income
2007 2.89
2008 0.86
Note 1: It meant for the year of the income generated.
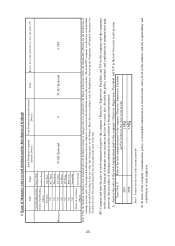
B. In terms of the company’s remuneration policy, a reasonable remuneration is based on the salary level of the industry and the responsibility and
contribution of each employee.