Asus 2008 Annual Report Download - page 215
Download and view the complete annual report
Please find page 215 of the 2008 Asus annual report below. You can navigate through the pages in the report by either clicking on the pages listed below, or by using the keyword search tool below to find specific information within the annual report.-
 1
1 -
2
-
3
-
4
-
5
-
6
-
7
-
8
-
9
-
10
-
11
-
12
-
13
-
14
-
15
-
16
-
17
-
18
-
19
-
20
-
21
-
22
-
23
-
24
-
25
-
26
-
27
-
28
-
29
-
30
-
31
-
32
-
33
-
34
-
35
-
36
-
37
-
38
-
39
-
40
-
41
-
42
-
43
-
44
-
45
-
46
-
47
-
48
-
49
-
50
-
51
-
52
-
53
-
54
-
55
-
56
-
57
-
58
-
59
-
60
-
61
-
62
-
63
-
64
-
65
-
66
-
67
-
68
-
69
-
70
-
71
-
72
-
73
-
74
-
75
-
76
-
77
-
78
-
79
-
80
-
81
-
82
-
83
-
84
-
85
-
86
-
87
-
88
-
89
-
90
-
91
-
92
-
93
-
94
-
95
-
96
-
97
-
98
-
99
-
100
-
101
-
102
-
103
-
104
-
105
-
106
-
107
-
108
-
109
-
110
-
111
-
112
-
113
-
114
-
115
-
116
-
117
-
118
-
119
-
120
-
121
-
122
-
123
-
124
-
125
-
126
-
127
-
128
-
129
-
130
-
131
-
132
-
133
-
134
-
135
-
136
-
137
-
138
-
139
-
140
-
141
-
142
-
143
-
144
-
145
-
146
-
147
-
148
-
149
-
150
-
151
-
152
-
153
-
154
-
155
-
156
-
157
-
158
-
159
-
160
-
161
-
162
-
163
-
164
-
165
-
166
-
167
-
168
-
169
-
170
-
171
-
172
-
173
-
174
-
175
-
176
-
177
-
178
-
179
-
180
-
181
-
182
-
183
-
184
-
185
-
186
-
187
-
188
-
189
-
190
-
191
-
192
-
193
-
194
-
195
-
196
-
197
-
198
-
199
-
200
-
201
-
202
-
203
-
204
-
 205
205 -
 206
206 -
 207
207 -
 208
208 -
 209
209 -
 210
210 -
 211
211 -
 212
212 -
 213
213 -
 214
214 -
 215
215 -
 216
216 -
 217
217 -
 218
218 -
 219
219 -
 220
220 -
 221
221 -
 222
222 -
 223
223 -
 224
224 -
 225
225 -
226
-
227
-
228
-
229
-
230
-
231
-
232
-
233
-
234
-
235
-
236
-
237
-
238
-
239
-
240
-
241
-
242
-
243
-
244
-
245
-
246
-
247
-
248
-
249
-
250
-
251
 |
 |
211
!
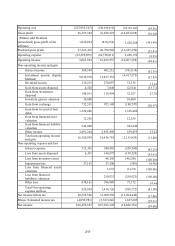
Operating cost (222,995,567) (548,696,610) 325,701,043 (59.36)
Gross profit 26,355,384 41,209,222 (14,853,838) (36.04)
(Minus) add: Realized
(unrealized) gross profit of the
affiliates
1,010,034 (418,254) 1,428,288 (341.49)
Realized gross profit 27,365,418 40,790,968 (13,425,550) (32.91)
Operating expense (22,299,855) (24,758,011)2,458,156 (9.93)
Operating income 5,065,563 16,032,957 (10,967,394) (68.41)
Non-operating income and gain
Interest income 300,394 802,212 (501,818) (62.55)
Investment income (Equity
Method) 9,039,978 13,457,553 (4,417,575) (32.83)
Dividend income 310,233 279,097 31,136 11.16
Gain from assets disposed 4,526 7,040 (2,514) (35.71)
Gain from investment
disposed 148,011 115,904 32,107 27.70
Inventory gain in valuation 10,000 - 10,000 -
Gain from exchange 732,351 923,148 (190,797) (20.67)
Gain from reversal of bad
debts 1,329,486 - 1,329,486 -
Gain from financial asset
valuation 12,256 - 12,256 -
Gain from financial liability
valuation 942,440 - 942,440 -
Other income 3,491,264 2,851,809 639,455 22.42
Total non-operating income
and gain 16,320,939 18,436,763 (2,115,824) (11.48)
Non-operating expense and loss
Interest expense 312,301 540,801 (228,500) (42.25)
Loss from assets disposed 6,351 144,675 (138,324) (95.61)
Loss from inventory count - 46,205 (46,205) (100.00)
Impairment loss 37,141 37,500 (359) (0.96)
Loss from financial assets
valuation - 1,635 (1,635) (100.00)
Loss from financial
liabilities valuation - 250,921 (250,921) (100.00)
Other loss 474,161 396,989 77,172 19.44
Total Non-operating
expense and loss 829,954 1,418,726 (588,772) (41.50)
Net income before tax 20,556,548 33,050,994 (12,494,446) (37.80)
Minus: Estimated income tax (4,099,981) (5,767,666) 1,667,685 (28.91)
Net income $16,456,567 $27,283,328 (10,826,761) (39.68)