Asus 2008 Annual Report Download - page 189
Download and view the complete annual report
Please find page 189 of the 2008 Asus annual report below. You can navigate through the pages in the report by either clicking on the pages listed below, or by using the keyword search tool below to find specific information within the annual report.-
 1
1 -
2
-
3
-
4
-
5
-
6
-
7
-
8
-
9
-
10
-
11
-
12
-
13
-
14
-
15
-
16
-
17
-
18
-
19
-
20
-
21
-
22
-
23
-
24
-
25
-
26
-
27
-
28
-
29
-
30
-
31
-
32
-
33
-
34
-
35
-
36
-
37
-
38
-
39
-
40
-
41
-
42
-
43
-
44
-
45
-
46
-
47
-
48
-
49
-
50
-
51
-
52
-
53
-
54
-
55
-
56
-
57
-
58
-
59
-
60
-
61
-
62
-
63
-
64
-
65
-
66
-
67
-
68
-
69
-
70
-
71
-
72
-
73
-
74
-
75
-
76
-
77
-
78
-
79
-
80
-
81
-
82
-
83
-
84
-
85
-
86
-
87
-
88
-
89
-
90
-
91
-
92
-
93
-
94
-
95
-
96
-
97
-
98
-
99
-
100
-
101
-
102
-
103
-
104
-
105
-
106
-
107
-
108
-
109
-
110
-
111
-
112
-
113
-
114
-
115
-
116
-
117
-
118
-
119
-
120
-
121
-
122
-
123
-
124
-
125
-
126
-
127
-
128
-
129
-
130
-
131
-
132
-
133
-
134
-
135
-
136
-
137
-
138
-
139
-
140
-
141
-
142
-
143
-
144
-
145
-
146
-
147
-
148
-
149
-
150
-
151
-
152
-
153
-
154
-
155
-
156
-
157
-
158
-
159
-
160
-
161
-
162
-
163
-
164
-
165
-
166
-
167
-
168
-
169
-
170
-
171
-
172
-
173
-
174
-
175
-
176
-
177
-
178
-
 179
179 -
 180
180 -
 181
181 -
 182
182 -
 183
183 -
 184
184 -
 185
185 -
 186
186 -
 187
187 -
 188
188 -
 189
189 -
 190
190 -
 191
191 -
 192
192 -
 193
193 -
 194
194 -
 195
195 -
 196
196 -
 197
197 -
 198
198 -
 199
199 -
200
-
201
-
202
-
203
-
204
-
205
-
206
-
207
-
208
-
209
-
210
-
211
-
212
-
213
-
214
-
215
-
216
-
217
-
218
-
219
-
220
-
221
-
222
-
223
-
224
-
225
-
226
-
227
-
228
-
229
-
230
-
231
-
232
-
233
-
234
-
235
-
236
-
237
-
238
-
239
-
240
-
241
-
242
-
243
-
244
-
245
-
246
-
247
-
248
-
249
-
250
-
251
 |
 |

185
ASUSTEK COMPUTER INC. AND SUBSIDIARIES
Notes to Consolidated Financial Statements
(In thousands of New Taiwan dollars unless otherwise stated)
Note: (Without considering the retrospective adjustments for bonds)
Net income of 2007 – Employees’ cash bonuses – Employees’ stock bonuses – Directors’ and supervisors’ bonuses
Average weighted number of shares of 2007
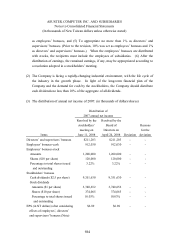
The distribution of annual net income of 2006: (in thousands of dollars/shares)
Distribution of
2006 annual net income
Items
Resolved by the
stockholders’
meeting on
June 13, 2007
Resolved by the
Board of Directors
on April 24, 2007
Deviation
Reasons
for the
deviation
Directors’ and supervisors’ bonuses
$138,871 $138,871
-
-
Employees’ bonuses-cash
688,712 688,712
-
-
Employees’ bonuses-stock
Amounts
700,000 700,000
-
-
Shares ($10 per share)
70,000 70,000
-
-
Percentage to total shares issued
and outstanding
2.05% 2.05%
-
-
Stockholders’ bonuses
Cash dividends ($1.5 per share)
5,118,124 5,118,124
-
-
Stock dividends
Amounts ($0.5 per share)
1,706,041 1,706,041
-
-
Shares ($10 per share)
170,604 170,604
-
-
Percentage to total shares issued
and outstanding
5.01% 5.01%
-
-
EPS (in NT dollars) after
considering
effects of employees’, directors’
and supervisors’ bonuses (Note)
$5.20
$5.20
-
-
Note: (Without considering the retrospective adjustments for bonds)
Net income of 2006 – Employees’ cash bonuses – Employees’ stock bonuses – Directors’ and supervisors’ bonuses
Average weighted number of shares of 2006