Asus 2008 Annual Report Download - page 89
Download and view the complete annual report
Please find page 89 of the 2008 Asus annual report below. You can navigate through the pages in the report by either clicking on the pages listed below, or by using the keyword search tool below to find specific information within the annual report.-
 1
1 -
2
-
3
-
4
-
5
-
6
-
7
-
8
-
9
-
10
-
11
-
12
-
13
-
14
-
15
-
16
-
17
-
18
-
19
-
20
-
21
-
22
-
23
-
24
-
25
-
26
-
27
-
28
-
29
-
30
-
31
-
32
-
33
-
34
-
35
-
36
-
37
-
38
-
39
-
40
-
41
-
42
-
43
-
44
-
45
-
46
-
47
-
48
-
49
-
50
-
51
-
52
-
53
-
54
-
55
-
56
-
57
-
58
-
59
-
60
-
61
-
62
-
63
-
64
-
65
-
66
-
67
-
68
-
69
-
70
-
71
-
72
-
73
-
74
-
75
-
76
-
77
-
78
-
 79
79 -
 80
80 -
 81
81 -
 82
82 -
 83
83 -
 84
84 -
 85
85 -
 86
86 -
 87
87 -
 88
88 -
 89
89 -
 90
90 -
 91
91 -
 92
92 -
 93
93 -
 94
94 -
 95
95 -
 96
96 -
 97
97 -
 98
98 -
 99
99 -
100
-
101
-
102
-
103
-
104
-
105
-
106
-
107
-
108
-
109
-
110
-
111
-
112
-
113
-
114
-
115
-
116
-
117
-
118
-
119
-
120
-
121
-
122
-
123
-
124
-
125
-
126
-
127
-
128
-
129
-
130
-
131
-
132
-
133
-
134
-
135
-
136
-
137
-
138
-
139
-
140
-
141
-
142
-
143
-
144
-
145
-
146
-
147
-
148
-
149
-
150
-
151
-
152
-
153
-
154
-
155
-
156
-
157
-
158
-
159
-
160
-
161
-
162
-
163
-
164
-
165
-
166
-
167
-
168
-
169
-
170
-
171
-
172
-
173
-
174
-
175
-
176
-
177
-
178
-
179
-
180
-
181
-
182
-
183
-
184
-
185
-
186
-
187
-
188
-
189
-
190
-
191
-
192
-
193
-
194
-
195
-
196
-
197
-
198
-
199
-
200
-
201
-
202
-
203
-
204
-
205
-
206
-
207
-
208
-
209
-
210
-
211
-
212
-
213
-
214
-
215
-
216
-
217
-
218
-
219
-
220
-
221
-
222
-
223
-
224
-
225
-
226
-
227
-
228
-
229
-
230
-
231
-
232
-
233
-
234
-
235
-
236
-
237
-
238
-
239
-
240
-
241
-
242
-
243
-
244
-
245
-
246
-
247
-
248
-
249
-
250
-
251
 |
 |

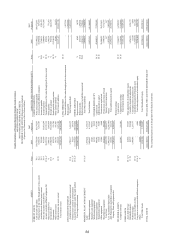
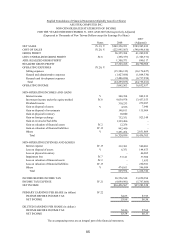
85
ASUSTEK COMPUTER INC.
NON-CONSOLIDATED STATEMENTS OF INCOME
FOR THE YEARS ENDED DECEMBER 31, 2008 AND 2007 (Retrospectively Adjusted)
(Expressed in Thousands of New Taiwan Dollars except for Earnings Per Share)
2007
Notes 2008 (Adjusted)
NET SALES IV.19, V $249,350,951 $589,905,832
COST OF SALES IV.20, V (222,995,567) (548,696,610)
GROSS PROFIT 26,355,384 41,209,222
LESS: UNREALIZED GROSS PROFIT IV.8 (298,337) (1,308,371)
ADD: REALIZED GROSS PROFIT 1,308,371 890,117
REALIZED GROSS PROFIT 27,365,418 40,790,968
OPERATING EXPENSES IV.20, V
Selling expenses (15,386,133) (16,176,427)
General and administrative expenses (1,427,686) (1,864,330)
Research and development expenses (5,486,036) (6,717,254)
Total (22,299,855) (24,758,011)
OPERATING INCOME 5,065,563 16,032,957
NON-OPERATING INCOMES AND GAINS
Interest income V300,394 802,212
Investment income under the equity method IV.8 9,039,978 13,457,553
Dividend income 310,233 279,097
Gain on disposal of assets V4,526 7,040
Gain on disposal of investments 148,011 115,904
Gain on physical inventory 10,000 -
Gain on foreign exchange 732,351 923,148
Gain on reversal of bad debts 1,329,486 -
Gain on valuation of financial assets IV.2 12,256 -
Gain on valuation of financial liabilities IV.13 942,440 -
Others V 3,491,264 2,851,809
Total 16,320,939 18,436,763
NON-OPERATING EXPENSES AND LOSSES
Interest expense IV.13 312,301 540,801
Loss on disposal of assets V6,351 144,675
Loss on physical inventory - 46,205
Impairment loss IV.7 37,141 37,500
Loss on valuation of financial assets IV.2 - 1,635
Loss on valuation of financial liabilities IV.13 - 250,921
Others V 474,161 396,989
Total 829,954 1,418,726
INCOME BEFORE INCOME TAX 20,556,548 33,050,994
INCOME TAX EXPENSE IV.21 (4,099,981) (5,767,666)
NET INCOME $16,456,567 $27,283,328
PRIMARY EARNINGS PER SHARE (in dollars) IV.22
INCOME BEFORE INCOME TAX $4.85 $7.95
NET INCOME $3.88 $6.56
DILUTED EARNINGS PER SHARE (in dollars)
INCOME BEFORE INCOME TAX $4.46 $7.64
NET INCOME $3.54 $6.33
English Translations of Financial Statements Originally Issued in Chinese
The accompanying notes are an integral part of the financial statements.