Acer 2008 Annual Report Download - page 60
Download and view the complete annual report
Please find page 60 of the 2008 Acer annual report below. You can navigate through the pages in the report by either clicking on the pages listed below, or by using the keyword search tool below to find specific information within the annual report.-
 1
1 -
2
-
3
-
4
-
5
-
6
-
7
-
8
-
9
-
10
-
11
-
12
-
13
-
14
-
15
-
16
-
17
-
18
-
19
-
20
-
21
-
22
-
23
-
24
-
25
-
26
-
27
-
28
-
29
-
30
-
31
-
32
-
33
-
34
-
35
-
36
-
37
-
38
-
39
-
40
-
41
-
42
-
43
-
44
-
45
-
46
-
47
-
48
-
49
-
 50
50 -
 51
51 -
 52
52 -
 53
53 -
 54
54 -
 55
55 -
 56
56 -
 57
57 -
 58
58 -
 59
59 -
 60
60 -
 61
61 -
 62
62 -
 63
63 -
 64
64 -
 65
65
 |
 |

Acer Incorporated 2008 Annual Report116
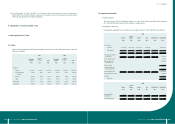
Financial Standing
Acer Incorporated 2008 Annual Report 117
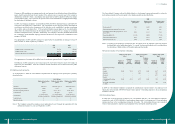
2008
Taiwan
North
America Europe Asia Eliminations Consolidated
NT$ NT$ NT$ NT$ NT$ NT$
Area income:
Customers 25,879,015 152,469,649 279,790,219 90,925,741 -549,064,624
Inter-company 341,107,152 3,203 6,057,224 13,642 (347,181,221) -
366,986,167 152,472,852 285,847,443 90,939,383 (347,181,221) 549,064,624
Area prot (loss) before
income taxes 342,361,748 (1,044,322) 15,501,048 3,361,512 (347,181,221) 12,998,765
Net investment income 404,184
Gain on disposal of
investments, net 2,709,524
Interest expense (1,305,746)
Consolidated income
before income taxes 14,806,727
Area identiable assets 111,929,202 47,044,049 95,789,881 25,518,735 (62,342,472) 217,939,395
Equity method investments 2,928,790
Goodwill 22,574,040
Total assets 243,442,225
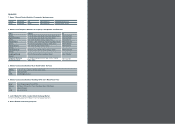
Depreciation and
amortization
685,120 1,090,051 290,210 136,060 - 2,201,441
Capital expenditures 171,677 220,011 154,207 205,397 - 751,292
(3) Export sales
Export sales of the Company and its domestic subsidiaries do not exceed 10% of the consolidated
revenues, hence no disclosure is required.
(4) Major customers:
No individual customers accounted for more than 10% of the consolidated revenues in 2007 and 2008.
7.5 Disclosure of the Impact on Company’s Financial Status Due to
Financial Difculties
Not applicable.
7.6 Financial Prediction and Achievements
7.6.1 Financial Forecast of Year 2007: Not applicable.