Acer 2008 Annual Report Download - page 59
Download and view the complete annual report
Please find page 59 of the 2008 Acer annual report below. You can navigate through the pages in the report by either clicking on the pages listed below, or by using the keyword search tool below to find specific information within the annual report.-
 1
1 -
2
-
3
-
4
-
5
-
6
-
7
-
8
-
9
-
10
-
11
-
12
-
13
-
14
-
15
-
16
-
17
-
18
-
19
-
20
-
21
-
22
-
23
-
24
-
25
-
26
-
27
-
28
-
29
-
30
-
31
-
32
-
33
-
34
-
35
-
36
-
37
-
38
-
39
-
40
-
41
-
42
-
43
-
44
-
45
-
46
-
47
-
48
-
 49
49 -
 50
50 -
 51
51 -
 52
52 -
 53
53 -
 54
54 -
 55
55 -
 56
56 -
 57
57 -
 58
58 -
 59
59 -
 60
60 -
 61
61 -
 62
62 -
 63
63 -
 64
64 -
 65
65
 |
 |

Acer Incorporated 2008 Annual Report114
Financial Standing
Acer Incorporated 2008 Annual Report 115
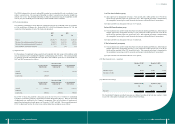
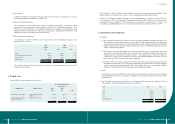
(4) As of December 31, 2007 and 2008, the Company had provided promissory notes amounting to
NT$23,429,875 and NT$29,150,262, respectively, as collateral for factored accounts receivable and for
obtaining credit facilities from nancial institutions.
8. Signicant Loss from Casualty: None
9. Subsequent Events: None
10. Other
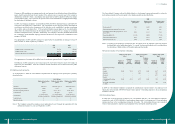
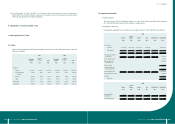
Total personnel, depreciation and amortization expenses incurred for the years ended December 31, 2007 and
2008, were as follows:
2007 2008
Operating
expense
Cost of
revenues
Total
Operating
expense
Cost of
revenues
Total
NT$ NT$ NT$ NT$ NT$ NT$
Personnel:
Salaries 7,456,623 1,471,263 8,927,886 11,184,723 1,549,798 12,734,521
Labor and health
insurance
314,286 20,431 334,717 376,773 23,377 400,150
Pension 260,829 56,592 317,421 448,196 17,042 465,238
Other 540,262 1,951 542,213 147,214 1,235 148,449
Depreciation 557,376 33,813 591,189 917,394 38,486 955,880
Amortization 549,545 1,735 551,280 791,510 454,051 1,245,561
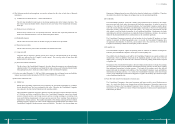
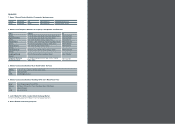
11. Segment Information
(1) Industry segment
The main business of the Consolidated Companies is to sell “Acer” brand-name desktop PCs, notebook
PCs, and other related IT products, which represents a single industry.
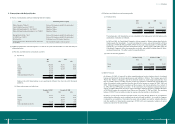
(2) Geographic information
Information by geographic area as of and the years ended December 31, 2007 and 2008, was as follows:
2007
Taiwan
North
America Europe Asia Eliminations Consolidated
NT$ NT$ NT$ NT$ NT$ NT$
Area income:
Customers 60,651,079 106,413,405 236,237,471 61,256,183 -464,558,138
Inter-company 264,931,647 4,101 7,242,154 11,096 (272,188,998) -
325,582,726 106,417,506 243,479,625 61,267,279 (272,188,998) 464,558,138
Area prot (loss) before
income taxes 264,812,614 926,347 15,381,028 2,194,840 (272,187,926) 11,126,903
Net investment income 695,660
Gain on disposal of
investments, net
4,045,981
Interest expense (759,907)
Consolidated income
before income taxes 15,108,637
Area identiable assets 100,327,411 58,022,952 88,086,758 28,618,423 (53,352,602) 221,702,942
Equity method investments 4,689,684
Goodwill 16,890,716
Total assets 243,283,342
2007
Taiwan
North
America Europe Asia Eliminations Consolidated
NT$ NT$ NT$ NT$ NT$ NT$
Depreciation and
amortization 1,088,239 32,112 11,239 10,879 - 1,142,469
Capital expenditures 665,555 59,128 140,593 185,338 - 1,050,664