Acer 2008 Annual Report Download - page 32
Download and view the complete annual report
Please find page 32 of the 2008 Acer annual report below. You can navigate through the pages in the report by either clicking on the pages listed below, or by using the keyword search tool below to find specific information within the annual report.-
 1
1 -
2
-
3
-
4
-
5
-
6
-
7
-
8
-
9
-
10
-
11
-
12
-
13
-
14
-
15
-
16
-
17
-
18
-
19
-
20
-
21
-
 22
22 -
 23
23 -
 24
24 -
 25
25 -
 26
26 -
 27
27 -
 28
28 -
 29
29 -
 30
30 -
 31
31 -
 32
32 -
 33
33 -
 34
34 -
 35
35 -
 36
36 -
 37
37 -
 38
38 -
 39
39 -
 40
40 -
 41
41 -
 42
42 -
43
-
44
-
45
-
46
-
47
-
48
-
49
-
50
-
51
-
52
-
53
-
54
-
55
-
56
-
57
-
58
-
59
-
60
-
61
-
62
-
63
-
64
-
65
 |
 |

Acer Incorporated 2008 Annual Report60
Financial Standing
Acer Incorporated 2008 Annual Report 61
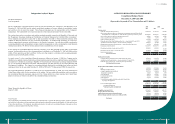
Independent Auditors’ Report
The Board of Directors
Acer Incorporated:
We have audited the consolidated balance sheets of Acer Incorporated (the “Company”) and subsidiaries as of
December 31, 2007 and 2008, and the related consolidated statements of income, changes in stockholders’ equity,
and cash flows for the years then ended. These financial statements are the responsibility of the Company’s
management. Our responsibility is to express an opinion on these nancial statements based on our audits.
We conducted our audits in accordance with auditing standards generally accepted in the Republic of China and with
the “Regulations Governing Auditing and Certication of Financial Statements by Certied Public Accountants”.
Those standards and regulations require that we plan and perform the audit to obtain reasonable assurance about
whether the nancial statements are free of material misstatement. An audit includes examining, on a test basis,
evidence supporting the amounts and disclosures in the nancial statements. An audit also includes assessing the
accounting principles used and signicant estimates made by management, as well as evaluating the overall nancial
statement presentation. We believe that our audits provide a reasonable basis for our opinion.
In our opinion, the consolidated nancial statements referred to in the rst paragraph present fairly, in all material
respects, the nancial position of Acer Incorporated and subsidiaries as of December 31, 2007 and 2008, and the
results of their operations and their cash ows for the years then ended, in conformity with accounting principles
generally accepted in the Republic of China.
As stated in note 3 to the consolidated financial statements, effective on January 1, 2008, the Company and its
subsidiaries recognized, measured and disclosed share-based payment transactions, employee bonuses, and directors’
and supervisors’ emoluments according to Republic of China Statement of Financial Accounting Standards (SFAS)
No. 39 “Accounting for Share-based Payment” and Interpretation (96) 052 issued by the Accounting Research and
Development Foundation. The changes in accounting principle decreased the consolidated net income and basic
earnings per share for the year ended December 31, 2008, by NT$1,483,776 thousand and NT$0.60, respectively.
The consolidated nancial statements as of and for the year ended December 31, 2008, have been translated into
United States dollars solely for the convenience of the readers. We have audited the translation, and in our opinion,
the consolidated financial statements expressed in New Taiwan dollars have been translated into United States
dollars on the basis set forth in note 2(26) to the consolidated nancial statements.
Taipei, Taiwan (the Republic of China)
March 27, 2009
Note to Readers
The accompanying consolidated nancial statements are intended only to present the nancial position, results of operations
and cash ows in accordance with accounting principles and practices generally accepted in the Republic of China and not those
of any other jurisdictions. The standards, procedures and practices to audit such consolidated financial statements are those
generally accepted and applied in the Republic of China.
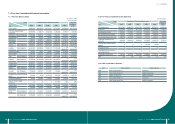
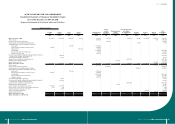
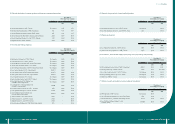
ACER INCORPORATED AND SUBSIDIARIES
Consolidated Balance Sheets
December 31, 2007 and 2008
(Expressed in thousands of New Taiwan dollars and US dollars)
Assets 2007 2008
NT$ NT$ US$
Current assets:
Cash and cash equivalents (note 4(1)) 37,945,339 22,141,725 674,682
Notes and accounts receivable, net of allowance for doubtful accounts of NT$2,356,672
and NT$898,972 as of December 31, 2008 and 2007, respectively (notes 4(2) and 6)
101,898,281
107,826,311
3,285,584
Notes and accounts receivable from related parties (note 5) 448,481 841,465 25,640
Other receivable from related parties (note 5) 59,403 45,173 1,376
Other receivables (note 4(3)) 7,375,569 8,807,454 268,373
Financial assets at fair value through prot or loss ‒ current (notes 4(5) and 4(25)) 19,982 354,751 10,810
Available-for-sale nancial assets ‒ current (notes 4(4) and 4(25)) 2,852,061 591,444 18,022
Hedging-purpose derivative nancial assets ‒ current (notes 4(6) and 4(25)) 235,198 1,022,782 31,165
Inventories (notes 4(7) and 6) 33,815,697 40,028,195 1,219,702
Prepayments and other current assets (note 4(8)) 2,828,601 1,525,555
46,485
Deferred income tax assets ‒ current (note 4(19)) 1,914,006 2,282,943 69,564
Restricted assets (note 6) 2,233,583 922,794 28,119
Total current assets 191,626,201 186,390,592 5,679,522
Funds and investments:
Long-term equity investments under equity method (note 4(10)) 4,689,684 2,928,790 89,243
Available-for-sale nancial assets ‒ noncurrent (notes 4(11) and 4(25)) 3,370,847 1,160,487 35,361
Financial assets carried at cost ‒ noncurrent (notes 4(9) and 4(25)) 3,142,121 2,684,270 81,793
Total funds and investments 11,202,652 6,773,547 206,397
Property, plant and equipment (notes 4(12) and 6):
Land 1,560,568 2,678,408 81,614
Buildings and improvements 3,627,214 5,294,056 161,316
Computer equipment and machinery 4,367,924 3,348,086 102,020
Transportation equipment 114,923 120,069 3,659
Ofce equipment 985,679 1,128,167 34,376
Leasehold improvements 487,647 816,904 24,892
Other equipment 723,029 1,136,428 34,628
Construction in progress and advance payments for purchases
of property and equipment 490,749 30,692 935
12,357,733 14,552,810 443,440
Less: accumulated depreciation (3,446,629) (4,922,662) (149,999)
accumulated impairment (274,663) (293,927) (8,956)
Net property, plant and equipment 8,636,441 9,336,221 284,485
Intangible assets (note 4(14)) 25,926,493 34,746,765 1,058,772
Property not in use (note 4(13)) 3,806,103 2,996,721 91,313
Other nancial assets (notes 4(15), 4(25) and 6) 961,393 868,760 26,472
Deferred charges and other assets (notes 4(18) and 4(19)) 1,124,059 2,329,619 70,986
Total assets 243,283,342 243,442,225 7,417,947