Acer 2008 Annual Report Download - page 55
Download and view the complete annual report
Please find page 55 of the 2008 Acer annual report below. You can navigate through the pages in the report by either clicking on the pages listed below, or by using the keyword search tool below to find specific information within the annual report.-
 1
1 -
2
-
3
-
4
-
5
-
6
-
7
-
8
-
9
-
10
-
11
-
12
-
13
-
14
-
15
-
16
-
17
-
18
-
19
-
20
-
21
-
22
-
23
-
24
-
25
-
26
-
27
-
28
-
29
-
30
-
31
-
32
-
33
-
34
-
35
-
36
-
37
-
38
-
39
-
40
-
41
-
42
-
43
-
44
-
 45
45 -
 46
46 -
 47
47 -
 48
48 -
 49
49 -
 50
50 -
 51
51 -
 52
52 -
 53
53 -
 54
54 -
 55
55 -
 56
56 -
 57
57 -
 58
58 -
 59
59 -
 60
60 -
 61
61 -
 62
62 -
 63
63 -
 64
64 -
 65
65
 |
 |

Acer Incorporated 2008 Annual Report106
Financial Standing
Acer Incorporated 2008 Annual Report 107
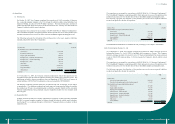
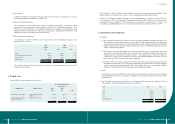
(23) Net income from discontinued operations
On July 1, 2007, the Company disposed of all its ownership interest in a subsidiary, Sertek Inc. The
operations of Sertek Inc. are classied as discontinued operations. The relevant income (loss) and cash ows
of the discontinued operations were as follows:
2007
NT$
Net revenues 9,398,700
Cost of revenues and operating expenses (9,224,222)
Non-operating income and expenses (64,502)
Income before income taxes 109,976
Income tax expense (23,120)
Net income from discontinued operations 86,856
Gain from disposal of discontinued operations 431,010
Total net income from discontinued operations 517,866
Discontinued operations’ cash ows:
Cash provided by (used in) operating activities (69,408)
Cash used in investing activities (645)
Cash used in nancing activities (118,307)
According to the sales agreement, if Sertek Inc. was able to achieve the stipulated profit in 2007, the
Company would be entitled to a contingent consideration. Accordingly, the Company obtained the
contingent consideration in cash amounting to NT$99,843 in 2008.
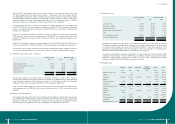
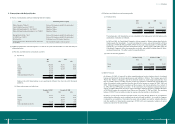
(24) Earnings per common share (“EPS”)
2007
Amount
Weighted-
average number
of outstanding
shares of common stock
(in thousands)
EPS
(in dollars)
NT$ NT$
Basic EPS – after retroactive adjustments:
Net income attributable to shareholders of
parent company 12,958,933 2,432,594 5.33
2008
Amount
Weighted-
average number
of outstanding
shares of common stock
(in thousands)
EPS
(in dollars)
NT$ US$ NT$ US$
Basic EPS – after retroactive adjustments:
Net income attributable to shareholders of
parent company 11,742,135 357,796 2,487,238 4.72 0.14
Diluted EPS:
Effect of dilutive potential common shares:
Employee bonus - - 39,042
Employee stock option plan - - 1,286
Net income attributable to shareholders of
parent company 11,742,135 357,796 2,527,566 4.65 0.14
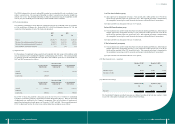
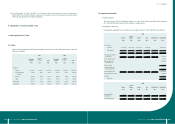
(25) Disclosure of nancial instruments
(a) Fair values of nancial instruments
The book value of short-term nancial instruments is considered to be the fair value because of the short-
term maturity of these instruments. Such method is applicable to cash and cash equivalents, notes and
accounts receivable (including receivables from related parties), other receivables (including receivables
from related parties), notes and accounts payables (including payables to related parties), short-term
borrowings, current installments of long-term debt and royalties payable.
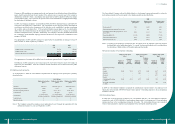
The estimated fair values and carrying amounts of all other nancial assets and liabilities as of December
31, 2007 and 2008, were as follows:
2007 2008
Fair value Fair value
Carrying
amount
Public
quoted
price
Valuation
amount
Carrying
amount
Public quoted
price
Valuation
amount
NT$ NT$ NT$ NT$ NT$ NT$
Non-derivative nancial instruments
Financial assets:
Available-for-sale nancial assets –
current
2,852,061 2,852,061 -591,444 591,444 1
Financial assets carried at cost 3,142,121 - see below (b) 2,684,270 - see below
(b)
Available-for-sale nancial assets –
noncurrent
3,370,847 3,370,847 1,160,487 1,160,487 -
Refundable deposits (classied as
“other nancial assets”)
687,109 -687,109 781,080 - 781,080
Noncurrent receivables (classied
as “other nancial assets”)
274,284 - 274,284 87,680 -87,680
Financial liabilities:
Long-term debt 16,790,876 -16,790,876 4,134,920 - 4,134,920
Derivative nancial instruments
Financial assets:
Foreign currency forward contracts 250,197 -250,197 1,302,085 -1,302,085
Foreign currency options 4,983 - 4,983 60,514 -60,514
Cross currency swap - - - 7,821 - 7,821
Foreign exchange swap - - - 7,113 - 7,113
Financial liabilities:
Foreign currency forward contracts 1,461,335 -1,461,335 1,860,479 -1,860,479
Foreign currency options 593 -593 23,298 - 23,298