Acer 2008 Annual Report Download - page 33
Download and view the complete annual report
Please find page 33 of the 2008 Acer annual report below. You can navigate through the pages in the report by either clicking on the pages listed below, or by using the keyword search tool below to find specific information within the annual report.-
 1
1 -
2
-
3
-
4
-
5
-
6
-
7
-
8
-
9
-
10
-
11
-
12
-
13
-
14
-
15
-
16
-
17
-
18
-
19
-
20
-
21
-
22
-
 23
23 -
 24
24 -
 25
25 -
 26
26 -
 27
27 -
 28
28 -
 29
29 -
 30
30 -
 31
31 -
 32
32 -
 33
33 -
 34
34 -
 35
35 -
 36
36 -
 37
37 -
 38
38 -
 39
39 -
 40
40 -
 41
41 -
 42
42 -
 43
43 -
44
-
45
-
46
-
47
-
48
-
49
-
50
-
51
-
52
-
53
-
54
-
55
-
56
-
57
-
58
-
59
-
60
-
61
-
62
-
63
-
64
-
65
 |
 |

Acer Incorporated 2008 Annual Report62
Financial Standing
Acer Incorporated 2008 Annual Report 63
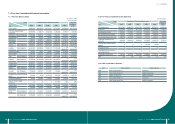
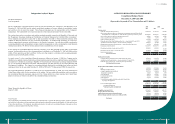
ACER INCORPORATED AND SUBSIDIARIES
Consolidated Balance Sheets
December 31, 2007 and 2008
(Expressed in thousands of New Taiwan dollars and US dollars)
Liabilities and Stockholders’ Equity 2007 2008
NT$ NT$ US$
Current liabilities:
Short-term borrowings (notes 4(16) and 6) 5,372,109 1,086, 851 33,117
Current installments of long-term debt (notes 4(17) and 6) 17,366 8,250,000 251,386
Notes and accounts payable 76,259,412 64,365,616 1,961,290
Notes and accounts payable to related parties (note 5) 4,583,615 7,750,220 236,158
Financial liabilities at fair value through prot or loss (notes 4(5) and 4(25)) 1,395,142 1,011,739 30,829
Other payables to related parties (note 5) 609,717 189,964 5,788
Hedging-purpose derivative nancial liabilities ‒ current (notes 4(6) and 4(25)) 66,786 872,038 26,572
Royalties payable 11,670,600 13,228,769 403,095
Accrued expenses and other current liabilities (note 4(19)) 42,867,827 52,559,961 1,601,559
Total current liabilities 142,842,574 149,315,158 4,549,794
Long-term liabilities:
Long-term debt, excluding current installments (notes 4(17), 4(25) and 6) 16,790,876 4,134,920 125,995
Other liabilities (note 4(18)) 1,121,524 840,433 25,609
Deferred income tax liabilities ‒ noncurrent (note 4(19)) 5,119,374 6,274,099 191,178
Total long-term liabilities 23,031,774 11,249,452 342,782
Total liabilities 165,874,348 160,564,610 4,892,576
Stockholders’ equity and minority interest (notes 3, 4(10), 4(20) and 4(21)):
Common stock 24,054,904 26,428,560 805,307
Capital surplus 29,898,983 37,129,952 1,131,390
Retained earnings
Legal reserve 7,490,689 8,786,583 267,737
Unappropriated earnings 13,551,024 13,985,318 426,148
Other stockholders’ equity components
Foreign currency translation adjustment 2,733,899 1,241,058 37,816
Minimum pension liability adjustment (173,364) (283) (9)
Unrealized gain (loss) on available-for-sale nancial assets 2,508,663 (1,456,066) (44,368)
Hedging reserve 15,836 (273,565) (8,336)
Treasury stock (3,270,920) (3,522,598) (107,337)
Total stockholders’ equity 76,809,714 82,318,959 2,508,348
Minority interest 599,280 558,656 17,023
Total stockholders’ equity and minority interest 77,408,994 82,877,615 2,525,371
Commitments and contingencies (note 7)
Total liabilities and stockholders’ equity 243,283,342 243,442,225 7,417,947
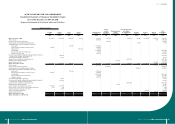
ACER INCORPORATED AND SUBSIDIARIES
Consolidated Statements of Income
Years ended December 31, 2007 and 2008
(Expressed in thousands of New Taiwan dollars and US dollars, except for per share data)
2007 2008
NT$ NT$ US$
Revenues (note 5) 462,066,080 546,274,115 16,645,564
Cost of revenues (note 5) (414,647,770) (488,988,455) (14,900,008)
Gross prot 47,418,310 57,285,660 1,745,556
Operating expenses (notes 4(14), 4(18), 4(21), 5, and 10)
Selling (32,727,126) (35,764,261) (1,089,776)
Administrative (4,156,402) (6,899,059) (210,222)
Research and development (349,659) (550,038) (16,760)
Total operating expenses (37,233,187) (43,213,358) (1,316,758)
Operating income 10,185,123 14,072,302 428,798
Non-operating income and gains:
Interest income 1,343,523 1,207,826 36,804
Investment gain recognized by equity method (note 4(10)) 695,660 404,184 12,316
Gain on disposal of property and equipment (note 4(12)) 121,418 515,272 15,701
Gain on disposal of investments, net (notes 4(4), 4(9), 4(10)
and 4(11))
4,045,981 2,709,524 82,562
Other income 493,089 516,232 15,730
6,699,671 5,353,038 163,113
Non-operating expenses and loss:
Interest expense (759,907) (1,305,746) (39,787)
Other investment loss (notes 4(9) and 4(10)) - (416,404) (12,688)
Restructuring cost (note 4(22)) - (1,582,408) (48,218)
Foreign currency exchange loss and loss on evaluation of
nancial instruments, net (notes 4(5) and 4(6)) (455,385) (866,315) (26,398)
Asset impairment loss (note 4(13)) - (221,931) (6,762)
Other loss (560,865) (225,809) (6,881)
(1,776,157) (4,618,613) (140,734)
Income from continuing operations before income taxes 15,108,637 14,806,727 451,177
Income tax expense (note 4(19)) (2,665,578) (3,169,446) (96,576)
Income from continuing operations 12,443,059 11,637,281 354,601
Income from discontinued operations (net of income taxes of NT$0 and
NT$23,120 in 2008 and 2007, respectively)
(note 4(23)) 517,866 99,843 3,042
Consolidated net income 12,960,925 11,737,124 357,643
Net income attributable to:
Shareholders of parent company 12,958,933 11,742,135 357,796
Minority shareholders 1,992 (5,011) (153)
12,960,925 11,737,124 357,643
Earnings per common share (in dollars) (note 4(24)):
Basic earnings per common share ‒ retroactively adjusted 5.33 4.72 0.14
Diluted earnings per common share 4.65 0.14