Acer 2008 Annual Report Download - page 42
Download and view the complete annual report
Please find page 42 of the 2008 Acer annual report below. You can navigate through the pages in the report by either clicking on the pages listed below, or by using the keyword search tool below to find specific information within the annual report.-
 1
1 -
2
-
3
-
4
-
5
-
6
-
7
-
8
-
9
-
10
-
11
-
12
-
13
-
14
-
15
-
16
-
17
-
18
-
19
-
20
-
21
-
22
-
23
-
24
-
25
-
26
-
27
-
28
-
29
-
30
-
31
-
 32
32 -
 33
33 -
 34
34 -
 35
35 -
 36
36 -
 37
37 -
 38
38 -
 39
39 -
 40
40 -
 41
41 -
 42
42 -
 43
43 -
 44
44 -
 45
45 -
 46
46 -
 47
47 -
 48
48 -
 49
49 -
 50
50 -
 51
51 -
 52
52 -
53
-
54
-
55
-
56
-
57
-
58
-
59
-
60
-
61
-
62
-
63
-
64
-
65
 |
 |

Acer Incorporated 2008 Annual Report80
Financial Standing
Acer Incorporated 2008 Annual Report 81
(24) Earnings per common share
Basic earnings per common share are based on net income divided by the weighted-average number of
outstanding common shares. The increase in the number of outstanding shares through non-compensated
distribution of shares (distribution of stock dividends from retained earnings or capital surplus or employee
bonus) is included in the outstanding shares retroactively.
Additionally, as the Company can choose to distribute employee bonuses by issuing stock shares, the
computation of diluted earnings per share is based on the assumption that all employee bonuses are
distributed in stock shares as of the balance sheet date.
(25) Business combination
Business combinations are accounted for in accordance with SFAS No. 25 “Business Combinations”. Acquisition
costs represent the amount of cash or cash equivalents paid and the fair value of the other purchase consideration
given, plus any costs directly attributable to the acquisition. The excess of acquisition cost over the fair value of
the net identiable tangible and intangible assets is recognized as goodwill.
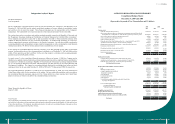
(26) Convenience translation into U.S. dollars
The consolidated nancial statements are stated in New Taiwan dollars. Translation of the 2008 New Taiwan
dollar amounts into U.S. dollar amounts, using the spot rate on December 31, 2008, of NT$32.818 to US$1,
is included solely for the convenience of the readers. The convenience translations should not be construed
as representations that the New Taiwan dollar amounts have been, could have been, or could in the future be,
converted into U.S. dollars at this or any other rate of exchange.
3. Accounting Changes
Effective on January 1, 2008, the Consolidated Company recognized and measured share-based payment
transactions, employee bonuses, and directors’ and supervisors’ remuneration according to Statement of Financial
Accounting Standards (SFAS) No. 39 “Accounting for Share-based Payment” and Interpretation (96) 052 issued
by the Accounting Research and Development Foundation. As a result, the Consolidated Company recognized
employee bonus and directors’ and supervisors’ remuneration expenses of NT$1,586,563. The aforementioned
changes in accounting principle resulted in the decrease in consolidated net income after tax and basic earnings
per share for the year ended December 31, 2008, of NT$1,483,776 thousand and NT$0.60, respectively.
Additionally, in accordance with Interpretation (97) 169 issued by the Accounting Research and Development
Foundation, if the stock dividends to employees as bonuses are potentially dilutive, they should be accounted for
in diluted earnings per common share.
4. Signicant Account Disclosures
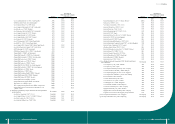
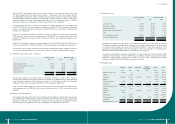
(1) Cash and cash equivalents
December 31, 2007 December 31, 2008
NT$ NT$ US$
Cash on hand 55,207 878,683 26,774
Bank deposits 14,908,552 13,690,489 417,164
Time deposits 22,981,580 7,572,553 230,744
37,945,339 22,141,725 674,682
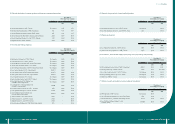
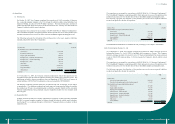
(2) Notes and accounts receivable
The Consolidated Companies entered into factoring contracts with several banks to sell certain of their
accounts receivable without recourse. As of December 31, 2007 and 2008, details of the contracts were as
follows:
December 31, 2007
Buyer
Factored
amount
Factoring
credit limit
Advance amount
(Derecognized
amount)
Interest rate
Collateral
ABN AMRO Bank $ 72,068 72,068 72,068 -
La Caixa Bank 4,415,967 6,577,855 4,415,967 -
Italia Factor S.P.A. 4,598,145 12,183,229 - -
Standard Chartered Bank 596,346 1,777,960 596,346 -
China Trust Bank 254,498 1,800,000 254,498 note 7(4)
Taipei Fubon Bank 823,824 1,000,000 823,824 note 7(4)
$ 10,760,848 23,411,112 6,162,703 1.62%~6.00%
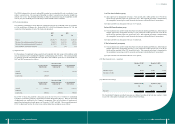
December 31, 2008
Buyer
Factored
amount
Factoring
credit limit
Advance amount
(Derecognized
amount)
Interest rate
Collateral
IFITALIA $ 10,018,176 11,226,373 2,866,914 -
ABN AMRO Bank 4,208,716 7,314,804 2,292,296 -
Standard Chartered Bank 2,213,795 6,563,600 2,213,795 -
Emirates Bank International 415,867 1,082,994 415,867 -
China Trust Bank 281,695 1,965,000 190,972 note 7(4)
Taipei Fubon Bank 514,716 1,000,000 514,716 note 7(4)
$ 17,652,965 29,152,771 8,494,560 1.51%~5.9%