Acer 2008 Annual Report Download - page 44
Download and view the complete annual report
Please find page 44 of the 2008 Acer annual report below. You can navigate through the pages in the report by either clicking on the pages listed below, or by using the keyword search tool below to find specific information within the annual report.-
 1
1 -
2
-
3
-
4
-
5
-
6
-
7
-
8
-
9
-
10
-
11
-
12
-
13
-
14
-
15
-
16
-
17
-
18
-
19
-
20
-
21
-
22
-
23
-
24
-
25
-
26
-
27
-
28
-
29
-
30
-
31
-
32
-
33
-
 34
34 -
 35
35 -
 36
36 -
 37
37 -
 38
38 -
 39
39 -
 40
40 -
 41
41 -
 42
42 -
 43
43 -
 44
44 -
 45
45 -
 46
46 -
 47
47 -
 48
48 -
 49
49 -
 50
50 -
 51
51 -
 52
52 -
 53
53 -
 54
54 -
55
-
56
-
57
-
58
-
59
-
60
-
61
-
62
-
63
-
64
-
65
 |
 |

Acer Incorporated 2008 Annual Report84
Financial Standing
Acer Incorporated 2008 Annual Report 85
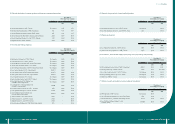
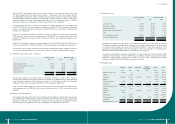
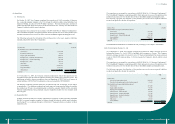
December 31,2008
Notional amount
(in thousand)
Settlement date
Buy Sell
USD /SGD USD 7,000 2009/01/14~2009/02/26
USD / CAD USD 47,806 2009/01/28~2009/02/26
EUR / CHF EUR 19,000 2008/01/05~2009/03/30
USD / EUR EUR 720,000 2009/01/15~2009/02/21
USD / INR USD 61,600 2009/01/06~2009/05/29
USD / MYR USD 19,138 2009/01/14~2009/02/17
USD /PHP USD 500 2009/01/15
USD / THB USD 28,700 2009/01/14~2009/05/29
USD / RMB USD 70,000 2009/02/02~2009/03/30
USD /JPY USD 5,000 2009/01/14
USD / NTD USD 5,000 2009/01/09~2009/01/22
(c) Cross currency swaps:
December 31, 2008
Notional amount
(in thousands)
Settlement
Date
Interest Interest due date
Swap-in SGD35,000/ 2009/01/23 Pay USD xed rate: 0.66% Principal and interest
Swap-out USD 24,221 Collect SGD xed rate: 1.00% paid in full when due
(d) Foreign exchange swaps:
December 31, 2008
Notional amount (in thousands) Settlement date
Swap-in USD / Swap-out NTD USD 160,000 / NTD 5,243,200 2009/01/15
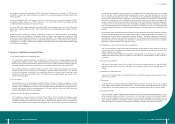
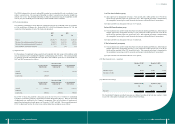
(6) Hedging derivative nancial assets and liabilities
The fair values of derivative nancial instruments were accounted for under the following accounts:
December 31, 2007 December 31, 2008
NT$ NT$ US$
Hedging derivative nancial assets – current:
Foreign currency forward contracts 235,198 962,268 29,321
Foreign currency options -60,514 1,844
235,198 1,022,782 31,165
Hedging derivative nancial liabilities – current
Foreign currency forward contracts (66,786) (848,740) (25,862)
Foreign currency options - (23,298) (710)
(66,786) (872,038) (26,572)
The Consolidated Companies entered into foreign currency forward contracts and foreign currency options to
hedge their exposure to changes in cash ows associated with foreign currency exchange risk resulting from
anticipated transactions denominated in foreign currencies.
As of December 31, 2007 and 2008, hedged items designated as fair value hedges and their respective hedging
derivative nancial instruments were as follows:
Fair value of hedging instruments
Hedged Items Hedging instruments December 31, 2007 December 31, 2008
Accounts receivable/ payable Foreign currency forward
denominated in foreign contracts and foreign 152,576 424,309
currencies currency options
On December 31, 2007 and 2008, the Consolidated Company recognized the realized remeasurement
gain from the derivative financial assets and liabilities designated as fair value hedges in the amount of
NTD394,271 thousand and NTD271,733 thousand, respectively.
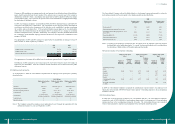
As of December 31, 2007 and 2008, hedged items designated as cash ow hedges and their respective hedging
derivative nancial instruments were as follows:
December 31, 2007
Hedged items Hedging instruments
Fair value
of hedging
instruments
Expected period
of cash ow
Expected period
of recognition in
earnings
Accounts payable denominated Foreign currency forward
in foreign currencies contracts 15,836 2008/01~04 2008/01~04
December 31, 2008
Hedged items Hedging instruments
Fair value
of hedging
instruments
Expected period
of cash ow
Expected period
of recognition in
earnings
Accounts payable denominated Foreign currency forward
in foreign currencies contracts and foreign (273,565) 2009/01~05 2009/01~05
currency options