Acer 2008 Annual Report Download - page 52
Download and view the complete annual report
Please find page 52 of the 2008 Acer annual report below. You can navigate through the pages in the report by either clicking on the pages listed below, or by using the keyword search tool below to find specific information within the annual report.-
 1
1 -
2
-
3
-
4
-
5
-
6
-
7
-
8
-
9
-
10
-
11
-
12
-
13
-
14
-
15
-
16
-
17
-
18
-
19
-
20
-
21
-
22
-
23
-
24
-
25
-
26
-
27
-
28
-
29
-
30
-
31
-
32
-
33
-
34
-
35
-
36
-
37
-
38
-
39
-
40
-
41
-
 42
42 -
 43
43 -
 44
44 -
 45
45 -
 46
46 -
 47
47 -
 48
48 -
 49
49 -
 50
50 -
 51
51 -
 52
52 -
 53
53 -
 54
54 -
 55
55 -
 56
56 -
 57
57 -
 58
58 -
 59
59 -
 60
60 -
 61
61 -
 62
62 -
63
-
64
-
65
 |
 |

Acer Incorporated 2008 Annual Report100
Financial Standing
Acer Incorporated 2008 Annual Report 101
December 31, 2007 December 31, 2008
NT$ NT$ US$
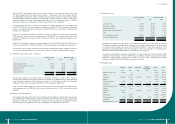
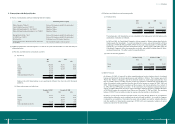
Deferred income tax liabilities – current:
Inventory provisions (88,624) (125,802) (3,833)
Allowance for doubtful accounts (473,449) (462,980) (14,108)
Others (147,624) (67,828) (2,067)
(709,697) (656,610) (20,008)
December 31, 2007 December 31, 2008
NT$ NT$ US$
Deferred income tax assets – non-current:
Difference in depreciation for tax and nancial purposes 12,042 20,638 629
Net operating loss carryforwards 624,286 773,919 23,582
Provision for asset impairment loss 293,190 - -
Investment tax credits 686,658 - -
Other 64,944 161,884 4,933
1,681,120 956,441 29,144
Valuation allowance (1,615,282) (826,526) (25,185)
65,838 129,915 3,959
December 31, 2007 December 31, 2008
NT$ NT$ US$
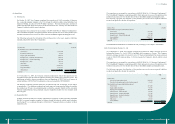
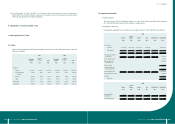
Deferred income tax liabilities – non-current:
Difference in intangible assets for tax and nancial
purposes (3,101,316) (2,705,258) (82,432)
Investment income recognized by the equity method (2,697,304) (3,804,043) (115,913)
Net operating loss carryforwards 14,028,055 14,326,766 436,552
Difference in depreciation for tax and nancial purposes 939,410 1,026,013 31,263
Provision for asset impairment loss 293,190 313,148 9,542
Investment tax credits - 418,227 12,744
Software development cost - 731,804 22,299
Unrealized investment loss 241,569 244,421 7,448
Other 147,919 463,409 14,121
9,851,523 11,014,487 335,624
Valuation allowance (14,970,897) (17,288,586) (526,802)
(5,119,374) (6,274,099) (191,178)
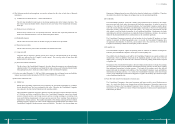
(e) The domestic Consolidated Companies were granted investment tax credits for investment in certain
high-tech industries, for the purchase of automatic machinery and equipment, for research and
development expenditures, and for employee training expenditures. These credits may be applied over
a period of ve years. The amount of the credit that may be applied in any year is limited to 50% of the
income tax payable for that year, but there is no limitation on the amount of investment tax credit that
may be applied in the nal year.
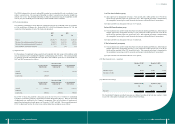
As of December 31, 2008, unused investment tax credits available to the Consolidated Companies were
as follows:
Expiration date NT$ US$
December 31, 2009 291,975 8,897
December 31, 2010 4,834 147
December 31, 2011 64,660 1,970
December 31, 2012 56,758 1,730
418,227 12,744
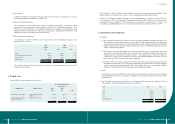
(f) The tax effects of net operating loss carryforwards available to the Consolidated Companies as of
December 31, 2008, were as follows:
Expiration date NT$ US$
December 31, 2009 144,655 4,408
December 31, 2010 10,737 327
December 31, 2011 992,846 30,253
December 31, 2012 1,088,663 33,173
Thereafter 12,941,761 394,349
15,178,662 462,510
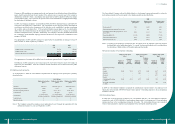
(g) Information about the integrated income tax system
Beginning in 1998, an integrated income tax system was implemented in the Republic of China. Under
the new tax system, the income tax paid at the corporate level can be used to offset Republic of China
resident stockholders’ individual income tax. The Company is required to establish an imputation credit
account (ICA) to maintain a record of the corporate income taxes paid and imputation credit that can
be allocated to each stockholder. The credit available to Republic of China resident stockholders is
calculated by multiplying the dividend by the creditable ratio. The creditable ratio is calculated as the
balance of the ICA divided by earnings retained by the Company since January 1, 1998.
Information related to the ICA is summarized below:
December 31, 2007 December 31, 2008
NT$ NT$ US$
Unappropriated earnings:
Earned before January 1, 1998 6,776 6,776 207
Earned after January 1, 1998 13,544,248 13,978,542 425,941
13,551,024 13,985,318 426,148
Balance of ICA 165,036 198,401 6,045
The Company’s estimated creditable ratio for the 2008 earnings distribution to ROC resident stockholders
is approximately 4.84%; and the actual creditable ratio for the 2007 earnings distribution to ROC resident
stockholders was 4.01%.