Acer 2008 Annual Report Download - page 18
Download and view the complete annual report
Please find page 18 of the 2008 Acer annual report below. You can navigate through the pages in the report by either clicking on the pages listed below, or by using the keyword search tool below to find specific information within the annual report.-
 1
1 -
2
-
3
-
4
-
5
-
6
-
7
-
 8
8 -
 9
9 -
 10
10 -
 11
11 -
 12
12 -
 13
13 -
 14
14 -
 15
15 -
 16
16 -
 17
17 -
 18
18 -
 19
19 -
 20
20 -
 21
21 -
 22
22 -
 23
23 -
 24
24 -
 25
25 -
 26
26 -
 27
27 -
 28
28 -
29
-
30
-
31
-
32
-
33
-
34
-
35
-
36
-
37
-
38
-
39
-
40
-
41
-
42
-
43
-
44
-
45
-
46
-
47
-
48
-
49
-
50
-
51
-
52
-
53
-
54
-
55
-
56
-
57
-
58
-
59
-
60
-
61
-
62
-
63
-
64
-
65
 |
 |
Acer Incorporated 2008 Annual Report32
Capital and Shares
Acer Incorporated 2008 Annual Report 33
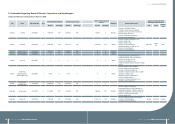
4.1 Sources of the Capital
4.1.1 Sources of the Capital (April 21, 2009)
Unit: Share/NT$ Thousand
Date Price of
Issuance
Authorized Common stock Paid-in Common stock Notes
Shares Value Shares Value Source of the capital
April,2009 Share/NT$10 3,500,000,000 35,000,000 2,642,982,993 26,429,830
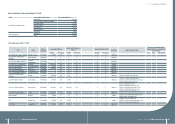
Unit: Share
Shares Category Authorized capital Notes
Issued shares Non-issued Total
Common shares 2,642,982,993 857,017,007 3,500,000,000
4.1.2 Shareholding Structure (April 21, 2009)
Category/Number Government
Institution
Financial
Institution Other Institution Individual
FINI and
Foreign
Investors
Total
No. of Shareholders 19 31 673 304,748 1,272 306,743
Shares 173,269,174 35,195,183 298,069,491 1,022,368,583 1,114,080,562 2,642,982,993
Percentage 6.56% 1.33% 11.28% 38.68% 42.15% 100.00%
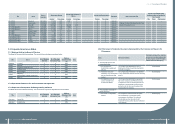
4.1.3 The Distribution of Shareholdings (April 21, 2009)
Category No. of Shareholders Shares Percentage
1 ~ 999 161,687 52,264,493 1.977%
1,000 ~ 5,000 108,926 231,996,525 8.778%
5,001 ~ 10,000 19,637 135,499,093 5.127%
10,001 ~ 15,000 6,776 79,792,333 3.019%
15,001 ~ 20,000 2,806 48,441,115 1.833%
20,001 ~ 30,000 2,598 61,991,711 2.346%
30,001 ~ 50,000 1,734 65,920,573 2.494%
50,001 ~ 100,000 1,155 79,631,458 3.013%
100,001 ~ 200,000 505 69,801,481 2.641%
200,001 ~ 400,000 342 96,360,504 3.646%
400,001 ~ 600,000 166 81,629,152 3.089%
600,001 ~ 800,000 79 55,324,451 2.093%
800,001 ~ 1,000,000 58 51,599,391 1.952%
1,000,001 and above 274 1,532,730,713 57.992%
Total 306,743 2,642,982,993 100.000%
4.1.4 The List of Major Shareholders (April 21, 2009)
Item
Name Shares Percentage
National Financial Stabilization Fund 74,850,000 2.83%
Stan Shih 74,021,741 2.80%
Hong Rong Investment Corp. 67,060,863 2.54%
Management Board of Public Service Pension Fund 52,154,978 1.97%
Acer Incorporated Global Depositary Receipt 51,659,897 1.95%
Government of Singapore Fund 43,142,880 1.63%
Saudi Arabian Monetary Agency 36,790,290 1.39%
JPMorgan Chase Bank N.A. Taipei Branch in custody for
Capital World Growth and Income Fund Inc. 31,753,338 1.20%
Capital Income Builder, Inc. 31,631,866 1.20%
Bureau of Labor Insurance 30,051,891 1.14%
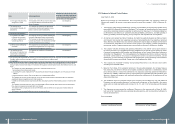
4.1.5 Market Price Per Share, Net Value, Earning& Dividend For Latest Two Years
Unit: NT$
Period
Item 2007 2008 Until Mar. 31st,
2009
Market Price
Per Share
Highest 75.96 70.20 51.00
Lowest 53.59 39.75 39.65
Average 62.35 55.51 45.48
Net Value Per
Share
Before Distribution 32.49 31.70 32.99
After Distribution 28.55 Un-appropriated Un-appropriated
Earning Per
Share
Weighted Average Share Numbers 2,432,594 2,487,238 2,596,619
Thousand shares Thousand shares thousand shares
Earning Per Share Current 5.48 4.72 0.78
Adjusted 5.33 Un-appropriated Un-appropriated
Dividend Per
Share
Cash Dividend (NT$) 3.6 2
Un-appropriated
Stock
Dividend
Retained Earning (%) 0.15 0.1
Capital Surplus (%) - -
Accumulated Unpaid Dividends - - -
Return on
Investment
Analysis
P/E Ratio 11.70 11.76 -
P/D Ratio 17.32 27.76 -
Cash Dividend Yield 5.77% 3.60% -