Acer 2008 Annual Report Download - page 35
Download and view the complete annual report
Please find page 35 of the 2008 Acer annual report below. You can navigate through the pages in the report by either clicking on the pages listed below, or by using the keyword search tool below to find specific information within the annual report.-
 1
1 -
2
-
3
-
4
-
5
-
6
-
7
-
8
-
9
-
10
-
11
-
12
-
13
-
14
-
15
-
16
-
17
-
18
-
19
-
20
-
21
-
22
-
23
-
24
-
 25
25 -
 26
26 -
 27
27 -
 28
28 -
 29
29 -
 30
30 -
 31
31 -
 32
32 -
 33
33 -
 34
34 -
 35
35 -
 36
36 -
 37
37 -
 38
38 -
 39
39 -
 40
40 -
 41
41 -
 42
42 -
 43
43 -
 44
44 -
 45
45 -
46
-
47
-
48
-
49
-
50
-
51
-
52
-
53
-
54
-
55
-
56
-
57
-
58
-
59
-
60
-
61
-
62
-
63
-
64
-
65
 |
 |

Acer Incorporated 2008 Annual Report66
Financial Standing
Acer Incorporated 2008 Annual Report 67
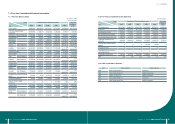
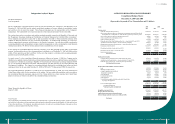
ACER INCORPORATED AND SUBSIDIARIES
Consolidated Statements of Cash Flows
Years ended December 31, 2007 and 2008
(Expressed in thousands of New Taiwan dollars and US dollars)
2007 2008
NT$ NT$ US$
Cash ows from operating activities:
Consolidated net income 12,960,925 11,737,124 357,643
Adjustments to reconcile net income to cash provided by operating activities:
Depreciation 591,189 955,880 29,127
Amortization 551,280 1,245,561 37,954
Gain on disposal of property and equipment, net (121,418) (515,272) (15,701)
Other expenses reclassied from property and equipment 4,369 - -
Gain on disposal of investments, net (4,476,991) (2,709,524) (82,562)
Net investment gain on long-term equity investments accounted for by equity
method, net of cash dividends received
(875,415) (146,392) (4,461)
Other investment loss - 416,404 12,688
Asset impairment loss - 221,931 6,762
Restructuring cost - 1,582,408 48,218
Stock-based compensation cost -37,856 1,153
Deferred income tax expense (benet) (61,297) 786,086 23,953
Changes in operating assets and liabilities:
Notes and accounts receivable (20,253,180) 452,252 13,781
Receivables from related parties (335,002) (327,579) (9,981)
Inventories (6,921,700) (4,882,424) (148,773)
Other nancial assets, prepayments and other current assets (1,055,734) (2,070,311) (63,084)
Noncurrent receivable 224,925 186,604 5,686
Notes and accounts payable (1,826,219) (16,097,164) (490,498)
Payables to related parties 3,409,436 2,447,835 74,588
Royalties payable, accrued expenses and other current liabilities 12,015,179 1,831,291 55,801
Other liabilities (391,122) (319,014) (9,721)
Cash used in operating activities (6,560,775) (5,166,448) (157,427)
Cash ow from investing activities:
Change in available-for-sale nancial assets ‒ current, net 12,332,596 2,891,868 88,118
Proceeds from sale of long-term equity investments and available for-sale nancial assets 7,018,429 3,449,388 105,107
Proceeds from sale of discontinued operations 868,222 - -
Increase in long-term investments (217,140) (171,717) (5,232)
Return of capital from investees 495,253 462,551 14,094
Proceeds from disposal of property and equipment and property not used in operations 1,220,389 2,068,099 63,017
Additions to property and equipment (534,626) (597,526) (18,207)
Increase in intangible assets and other assets (1,427,547) (435,746) (13,278)
Decrease (increase) in advances to related parties 14,771 (14,230) (434)
Decrease (increase) in restricted assets (1,958,585) 1,813,448 55,258
Acquisition of business, net of cash acquired (15,070,542) (719,026) (21,909)
Cash provided by investing activities 2,741,220 8,747,109 266,534
Cash ows from nancing activities:
Decrease in short-term borrowings (968,414) (4,285,258) (130,576)
Increase in long-term debt 16,500,000 - -
Payment of long-term debt (9,739,562) (4,423,321) (134,783)
Payment of cash dividends, employee bonuses, and directors’ and supervisors’ remuneration (9,395,445) (9,206,292) (280,526)
Exercise of employee stock options - 2,101 64
Change in minority interests (296,018) (42,353) (1,291)
Cash used in nancing activities (3,899,439) (17,955,123) (547,112)
Net decrease in cash and cash equivalents (7,718,994) (14,374,462) (438,005)
Effects of exchange rate changes 979,122 (1,429,152) (43,548)
Cash and cash equivalents at beginning of year 44,685,211 37,945,339 1,156,235
Cash and cash equivalents at end of year 37,945,339 22,141,725 674,682
Supplemental disclosures of cash ow information
Interest paid 1,052,609 1,275,330 38,861
Income taxes paid 1,395,005 1,977,802 60,266
Cash acquired from acquisition of subsidiaries: Gateway Inc. Parkard Bell BV Parkard Bell BV
Cash consideration 23,507,016 3,172,080 96,657
Non-cash assets acquired (35,589,573) (10,560,058) (321,776)
Liabilities assumed 37,173,295 10,704,787 326,186
Goodwill (16,654,264) (1,774,172) (54,061)
Cash acquired from acquisition 8,436,474 1,542,637 47,006
E-Ten
Information
Systems Co., Ltd.
E-Ten
Information
Systems Co., Ltd.
Issuance of shares for acquisition 8,837,267 269,281
Non-cash assets acquired (7,288,921) (222,101)
Liabilities assumed 1,263,892 38,512
Goodwill (1,901,821) (57,951)
Cash acquired from acquisition 910,417 27,741
ACER INCORPORATED AND SUBSIDIARIES
Notes to Consolidated Financial Statements
As of and for the years ended
December 31, 2007 and 2008
(amounts expressed in thousands of New Taiwan dollars and US dollars,
except for earnings per share information and unless otherwise noted)
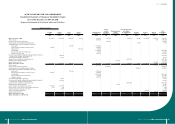
1. Reporting Entities of the Consolidated Financial Statements and Their Business Scopes
Acer Sertek Inc. (the “Company”) was incorporated on August 1, 1976, as a company limited by shares under
the laws of the Republic of China (“ROC”). The Company merged with Acer Incorporated (“AI”) on March 27,
2002, with the Company as the surviving entity from the merger but renaming itself Acer Incorporated. After
the merger, the principal activities of the Company focus on globally marketing its brand-name IT products, and
promoting E-commerce solutions to clients.
The reporting entities of the consolidated financial statements include the Company and its subsidiaries
(hereinafter referred to collectively as the “Consolidated Companies”). On December 31, 2007 and 2008, the
number of employees of the Consolidated Companies was 6,271 and 6,727, respectively. The Consolidated
Companies are summarized below according to their primary business activity.
(1) Sale of “Acer”, “Gateway”, “eMachine”, and “Packard Bell” brand-name information technology products:
Percentage of
Ownership by the Company
Investor at December 31,
2007 2008
(a) Acer Incorporated
(b) Acer Greater China (B.V.I.) Corp. (“AGC”, British Virgin Islands)
and its subsidiaries The Company 100.00 100.00
‧Acer Market Services Limited (“AMS”, Hong Kong) AGC 100.00 100.00
‧Acer Computer (Far East) Limited (“AFE”, Hong Kong) AGC 100.00 100.00
‧Acer Information (Zhong Shan) Co., Ltd. (“AIZS”, China) AMS 100.00 100.00
‧Beijing Acer Information Co., Ltd. (“BJAI”, China) AMS 100.00 100.00
‧Acer Computer (Shanghai) Ltd. (“ACCN”, China) AMS 100.00 100.00
(c) Acer European Holding N.V. (“AEH”, Netherlands Antilles )
and its subsidiaries The Company 100.00 100.00
‧Acer Europe B.V. (“AHN”, the Netherlands) AEH 100.00 100.00
‧Acer Computer B.V. (“ACH”, the Netherlands) AEH 100.00 100.00
‧Acer Computer France S.A.R.L. (“ACF”, France) AHN 100.00 100.00
‧Acer U.K. Limited (“AUK”, the United Kingdom) AHN 100.00 100.00
‧Acer Italy S.R.L. (“AIT”, Italy) AHN 100.00 100.00
‧Acer Computer GmbH (“ACG”, Germany) AHN 100.00 100.00
‧Acer Austria GmbH (“ACV”, Austria) AHN 100.00 100.00
‧Acer Europe Services S.R.L. (“AES”, Italy) AHN 100.00 100.00
‧Acer Europe AG (“AEG”, Switzerland) AHN 100.00 100.00