Acer 2008 Annual Report Download - page 29
Download and view the complete annual report
Please find page 29 of the 2008 Acer annual report below. You can navigate through the pages in the report by either clicking on the pages listed below, or by using the keyword search tool below to find specific information within the annual report.-
 1
1 -
2
-
3
-
4
-
5
-
6
-
7
-
8
-
9
-
10
-
11
-
12
-
13
-
14
-
15
-
16
-
17
-
18
-
 19
19 -
 20
20 -
 21
21 -
 22
22 -
 23
23 -
 24
24 -
 25
25 -
 26
26 -
 27
27 -
 28
28 -
 29
29 -
 30
30 -
 31
31 -
 32
32 -
 33
33 -
 34
34 -
 35
35 -
 36
36 -
 37
37 -
 38
38 -
 39
39 -
40
-
41
-
42
-
43
-
44
-
45
-
46
-
47
-
48
-
49
-
50
-
51
-
52
-
53
-
54
-
55
-
56
-
57
-
58
-
59
-
60
-
61
-
62
-
63
-
64
-
65
 |
 |

Acer Incorporated 2008 Annual Report54
Financial Standing
Acer Incorporated 2008 Annual Report 55
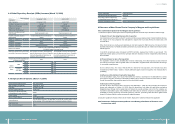
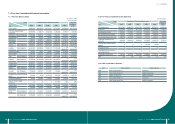
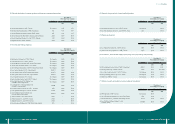
7.1 Five-Year Consolidated Financial Information
7.1.1 Five-Year Balance Sheet
As of March 31, 2009
Unit: NT$ Thousand
Period
Item
Most Recent 5-Year Financial Information Current Year
as of Mar.31,
2009
2004 2005 2006 2007 2008
Current Assets 85,029,907 139,242,560 161,267,661 191,626,201 186,390,592 201,740,858
Fund and Long-term Equity
Investments 20,644,599 17,605,973 13,835,538 11,202,652 6,773,547 7,445,583
Net Property, Plant and Equipment 13,446,980 9,468,157 6,190,501 8,636,441 9,336,221 9,262,067
Intangible Assets 784,296 501,878 396,682 25,926,493 34,746,765 37,656,421
Other Assets 4,555,507 4,763,374 6,809,916 5,891,555 6,195,100 6,373,407
Total Assets 124,461,289 171,581,942 188,500,298 243,283,342 243,442,225 262,478,335
Current Before Distribution 59,898,759 102,158,601 109,970,460 142,842,574 149,315,158 164,687,935
Liabilities After Distribution 64,857,922 109,390,340 119,487,678 152,163,698 Un-
appropriated
Un-
appropriated
Long-term Liabilities 257,007 146,623 168,627 16,790,876 4,134,920 4,116,219
Other Liabilities 2,087,804 2,027,268 2,805,428 6,240,899 7,114,532 7,432,099
Total Before Distribution 62,243,570 104,332,491 112,944,515 165,874,348 160,564,610 176,236,253
Liabilities After Distribution 67,202,733 111,564,230 122,461,733 175,195,472 Un-
appropriated
Un-
appropriated
Common stock 20,933,677 22,545,187 23,370,637 24,054,904 26,428,560 26,428,560
Capital surplus 30,541,969 30,552,132 29,947,020 29,898,982 37,129,952 37,203,104
Retained Before Distribution 13,211,567 16,123,212 18,284,265 21,041,713 22,771,901 24,797,631
Earnings After Distribution 8,252,404 8,891,473 8,767,047 11,720,589 Un-
appropriated
Un-
appropriated
Unrealized Gain (loss) on Financial
Assets (731,426) 65,608 4,361,608 2,524,500 (1,729,631) (1,085,579)
Translation Adjustments 132,516 (226,806) 1,335,500 2,733,899 1,241,058 1,844,113
Minimum Pension Liability
Adjustment (0) (0) 0 (173,364) (283) (283)
Treasury Stock (3,411,280) (3,270,920) (3,270,920) (3,270,920) (3,522,598) (3,522,598)
Minority Interest 1,540,696 1,461,038 1,527,674 599,280 558,656 577,134
Stockholders’
Equity Before Distribution 62,217,719 67,249,451 75,555,783 77,408,994 82,877,615 86,242,082
After Distribution 57,258,556 60,017,712 66,038,565 68,087,869 Un-
appropriated
Un-
appropriated
7.1.2 Five-Year Consolidated Income Statement
Unit: NT$ Thousand
Period
Item
Most Recent 5-Year Financial Information Current Year
as of Mar.31,
2009
2004 2005 2006 2007 2008
Operating Revenue 225,014,007 318,087,679 350,816,353 462,066,080 546,274,115 119,086,448
Gross Prot 27,219,303 34,121,461 38,171,313 47,418,310 57,285,660 11,918,367
Operating (loss) Income 3,806,657 7,648,961 7,462,446 10,185,123 14,072,302 2,570,574
Non-operating Income and Gain 6,742,733 7,176,374 9,266,120 6,699,671 5,353,038 467,666
Non-operating Expense and Loss 1,908,790 4,172,803 3,180,259 1,776,157 4,618,613 282,903
Continuing Operating Income
before Tax 8,640,600 10,652,532 13,548,307 15,108,637 14,806,727 2,755,337
Income(Loss) from Discontinued
Segment 0 0 0 517,866 99,843 0
Extraordinary Items 0 0 0 0 0 0
Cumulative Effect of changes in
Accounting Principle 0 0 0 0 0 0
Income after Income Taxes 7,011,661 8,477,502 10,218,242 12,958,933 11,742,135 2,025,730
EPS 2.86 3.48 4.20 5.33 4.72 0.78
7.1.3 CPAs and Auditor’s Opinions:
Year Name of CPA(s) Auditor’s Opinion
2004 Sonia Chang, Winston Yu Unreserved
2005 Sonia Chang, Winston Yu Modied Unreserved
2006 Winston Yu, Albert Lou Modied unreserved
2007 Sonia Chang, Winston Yu Unreserved
2008 Sonia Chang, Agnes Yang Modied unreserved