Acer 2008 Annual Report Download - page 6
Download and view the complete annual report
Please find page 6 of the 2008 Acer annual report below. You can navigate through the pages in the report by either clicking on the pages listed below, or by using the keyword search tool below to find specific information within the annual report.-
 1
1 -
 2
2 -
 3
3 -
 4
4 -
 5
5 -
 6
6 -
 7
7 -
 8
8 -
 9
9 -
 10
10 -
 11
11 -
 12
12 -
 13
13 -
 14
14 -
 15
15 -
 16
16 -
 17
17 -
18
-
19
-
20
-
21
-
22
-
23
-
24
-
25
-
26
-
27
-
28
-
29
-
30
-
31
-
32
-
33
-
34
-
35
-
36
-
37
-
38
-
39
-
40
-
41
-
42
-
43
-
44
-
45
-
46
-
47
-
48
-
49
-
50
-
51
-
52
-
53
-
54
-
55
-
56
-
57
-
58
-
59
-
60
-
61
-
62
-
63
-
64
-
65
 |
 |

Acer Incorporated 2008 Annual Report8
Business Report to Shareholders
Acer Incorporated 2008 Annual Report 9
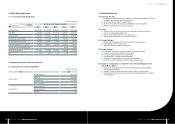
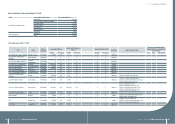
1.2 2008 Operating Report
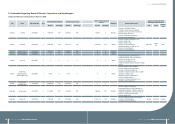
1.2.1 Consolidated Operating Results:
(Unit: NT$ Thousand)
Period
Item
Most Recent 5-Year Financial Information
2004 2005 2006 2007 2008
Operating Revenue 225,014,007 318,087,679 350,816,353 462,066,080 546,274,115
Gross Prot 27,219,303 34,121,461 38,171,313 47,418,310 57,285,660
Operating Income 3,806,657 7,648,961 7,462,446 10,185,123 14,072,302
Non-operating Income and Gain 6,742,733 7,176,374 9,266,120 6,699,671 5,353,038
Non-operating Expense and Loss 1,908,790 4,172,803 3,180,259 1,776,157 4,618,613
Continuing Operating Income before Tax 8,640,600 10,652,532 13,548,307 15,108,637 14,806,727
Income(Loss) from Discontinued Segment 0 0 0 517,866 99,843
Income after Income Taxes 7,011,661 8,477,502 10,218,242 12,958,933 11,742,135
EPS 2.86 3.48 4.20 5.33 4.72
1.2.2 Budget Expenditure in 2008: Not applicable.
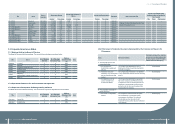
1.2.3 Financial Income and Earning Abilities
(Unit:NT$ Thousand)
Item 2008
Financial Income
Operating Revenue 546,274,114
Gross Prot 57,285,660
Income After Tax 11,742,135
Return on Assets(%) 5.23
Earning Abilities
Return on Equity(%) 14.65
Net Income ratio (%) 2.15
EPS(NT$) 4.72
1.3 2009 Business Plan
1.3.1 Business Direction
A. Implement the multi-brand strategy worldwide, with differentiated multi-brand products
to satisfy diverse customer and market segments.
B. Expand Acer Group’s global PC market share.
C. Improve time-to-market by enhancing order fulllment and global logistics.
D. Maintain control and minimize operating expenses.
1.3.2 Goals
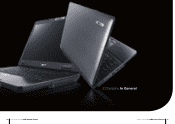
A. Introduce a full line of power-saving, all-day computing and ultra-thin notebooks
with the aim of expanding market share
B. Double annual netbook shipments over previous year.
C. Achieve signicant growth in the U.S., China and Japan.
1.3.3 Partner Strategy
A. Reinforce the cooperation with rst-tier suppliers and channel partners.
B. Fully capitalize on partners’ resources.
C. Share the success by rewarding our partners.
1.3.4 Future Strategy
The Company will make every endeavor to pursue the strategy for growth:
A. Continue and enhance the channel business model.
B. Enhance the global management of all operations.
C. Increase efforts on corporate social responsibility.
D. Generate more proportionate revenues from the geographies.
E. Entry into the smart handheld and mobile communications markets.
1.3.5 Impact on Company Due to Competition, Governmental Regulations and
Overall Macro Market
A. Slowdown of the global economy continues through 2009, making the prediction
of PC market trend difcult.
B. Volatile PC market condition may result in wide uctuation of channel needs.
C. The notebook PC market remains the segment with the brightest prospect compared
to other segments.